Background information
In recent years, with the government expanding its efforts to promote the green energy development policy, related renewable energies such as photovoltaics, wind power, hydroelectricity and geothermal power, all of which are Distributed Energy Resources (DER), will be massively grid-connected to the distribution system, and it will significantly change the entire distribution network structure. The electric power will no longer be generated by the generator units in large power plants, but rather be generated by small and decentralized devices. In order to fully understand the grid-connection status of the renewable energies, Taipower began to develop the Distribution Planning Information System (DPIS) since years ago, attempting to regulate the possible impact to the system when those energies are grid-connected by adopting the application review mechanism for Distributed Energy Resources.
According to records, there are nearly 10,000 feeders in the power distribution lines in Taiwan. The amount of data is huge and its number in the hosting capacity sections is as high as 3.26 million. When presented on a traditional web-based graphics platform, it would consume a considerable amount of software and hardware resources and may result in performance problems caused by a large amount of map data loading. Therefore, the Map Tile display technology will be used to generate the map tile files after the incorporation of timed calculations of each hosting capacity section, and then combined with the TGOS Address Geocoding Service and the generic version of the electronic maps to construct the visualized distribution feeder hosting capacity system. The system provides the public or the industry to conduct a location query by means of an address to achieve the purpose of visualizing the distribution feeder hosting capacity
System architecture description
The system is divided into two parts: the internal system and the external system. The architecture picture are shown in Fig1.
In order to allow external users to have a more intuitive understanding on the possible hosting capacity of feeder line, this project will regularly extract the topology information of existing distribution equipment from each business branch of Taipower by using the Extract-Transform-Load (ETL) technology. This project then simplifies it to become the information structure required to calculate the possible hosting capacity and subsequently summarize and send it to the information center as the basic information for computation.
We tested several computing cores and compared their benefits. Analyze its accuracy and calculation speed, and choose the best one.
Calculation results will integrate to the Geographic Information System (GIS) technology and displaying the possible hosting capacity of each feed line section on the map with colors.
Furthermore, to solve the performance issue that may be caused by external users downloading a large number of map data, this project constructs a feeder hosting capacity visualization system by using Map Tile display technology. It was thereby achieving the establishing hosting capacity visualization of the feeder.
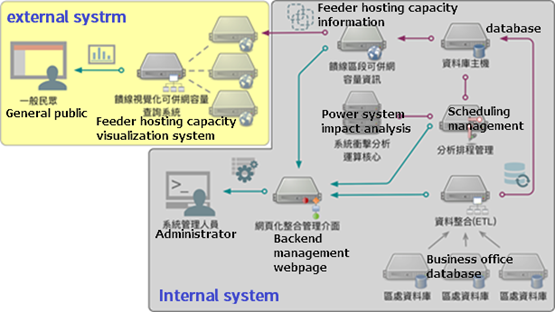
Fig 1. The architecture of Feeder Hosting capacity visualization system
Power system impact analysis
This system integrates data from several systems automatically, such as Distribution Mapping Management System, Renewable Energy Management Systems, Distribution Planning Information Systems, etc. Input data mainly include wire parameters, transformer parameters, electrical connectivity, power distribution equipment data, transformer data, load data, renewable energy data, user data, coordinate points, etc. Comprehensively organize all the materials and build a complete feeder input file. The schematic diagram of power system impact analysis is shown in Fig.2.
Taipower has about 10,000 total feeders, and the number of calculations for each joint is very large. Considering the overall load of the mainframe and the accuracy of the data, the core of the most cost-saving calculation is adopted. Each joint will be inversely calculated one by one, and get the maximum hosting capacity finally. It will be the basis of updating the externally displayable hosting capacity.
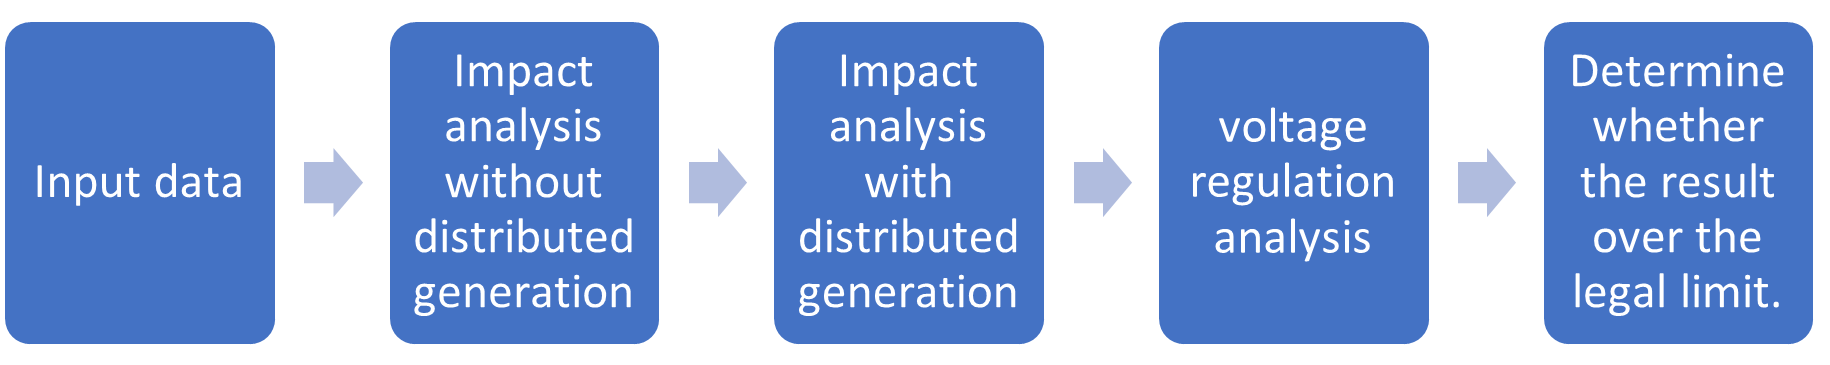
Fig 2. Schematic diagram of power system impact analysis
System introduction
In order to allow the user to clearly view the hosting capacity of each section of feeder, we indicate the hosting capacity of each section by means of color display. This referred to the webpages which are built by the foreign electricity utility.
The hosting capacity is divided into six levels and six colors from small to large, and display on the geographic map.
- Feeder hosting capacity visualization system for power distribution system:http://hcweb.taipower.com.tw/
- Line hosting capacity visualization system for Transmission power supply system(Due to national security issues, only opened for internal use):http://pvgis.taipower.com.tw/ltfl/
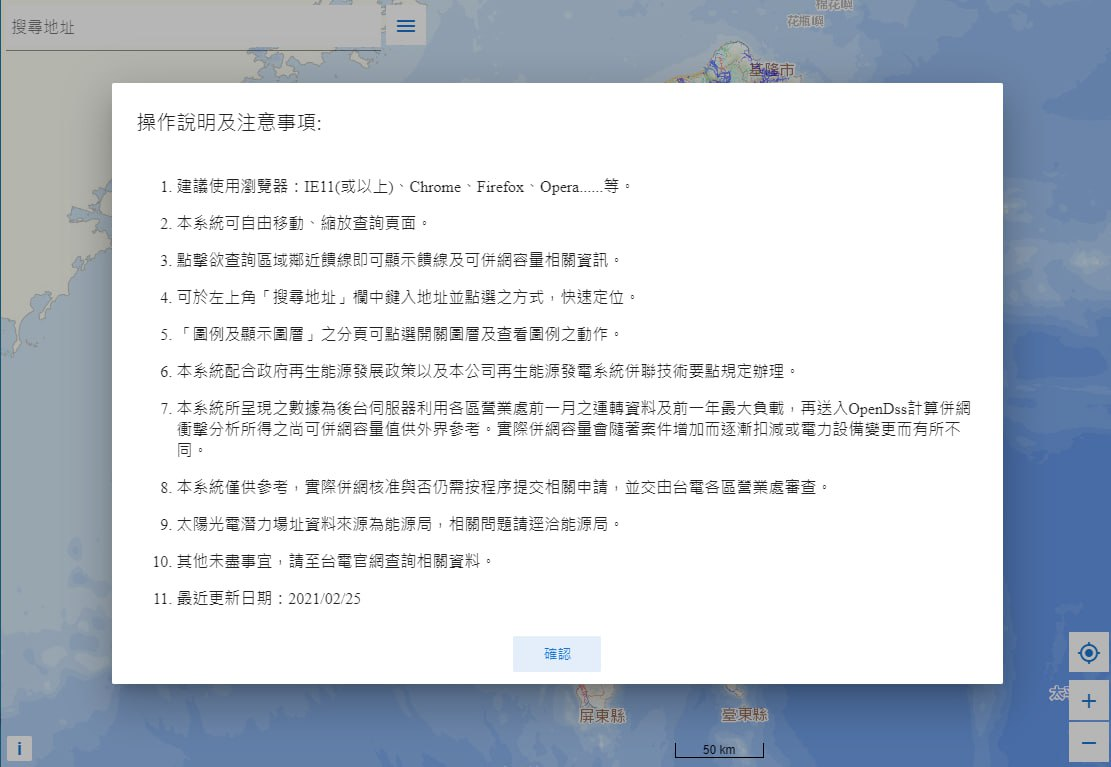
Fig3. System introduction page
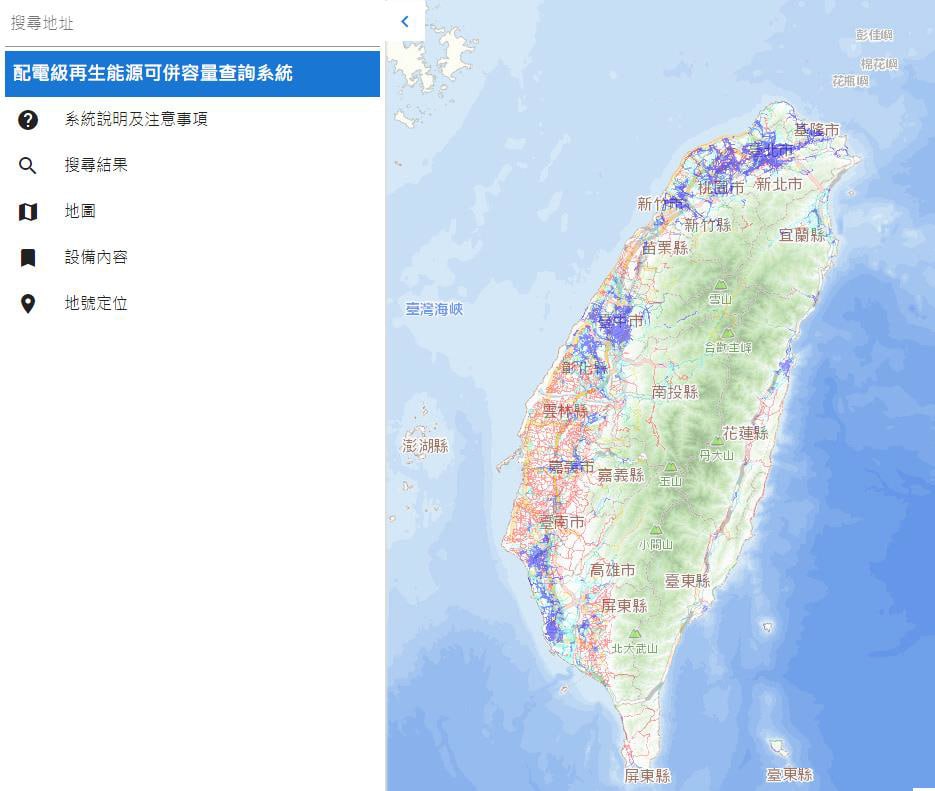
Fig4. Side information bar
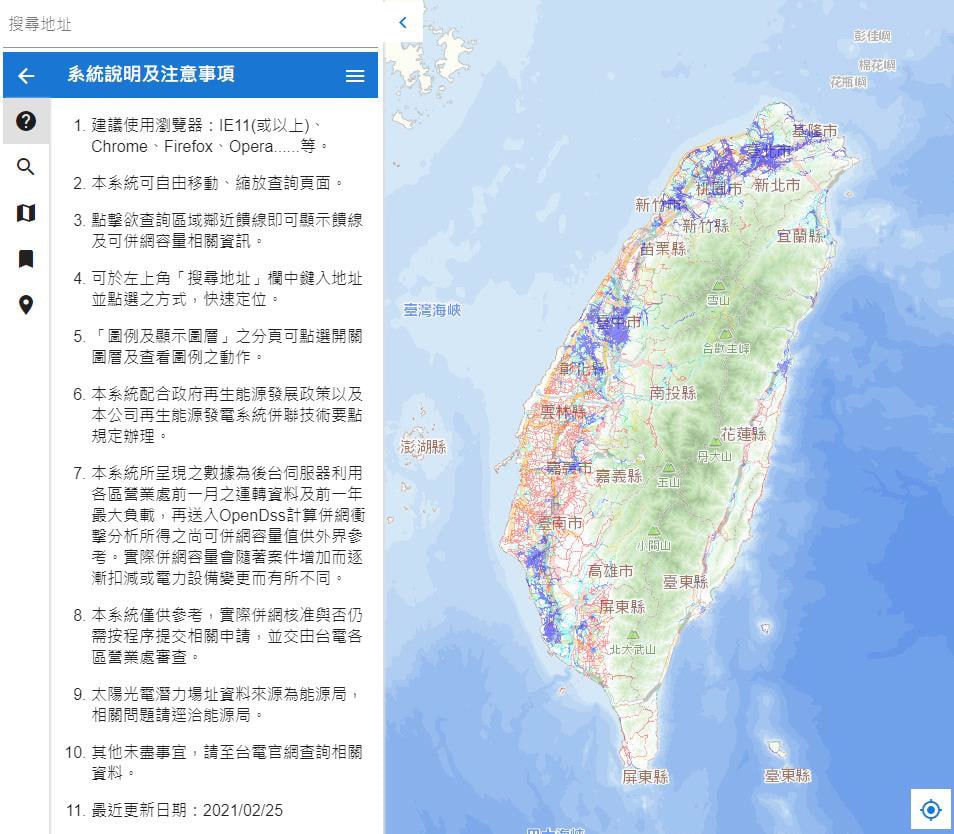
Fig5. System description and notices
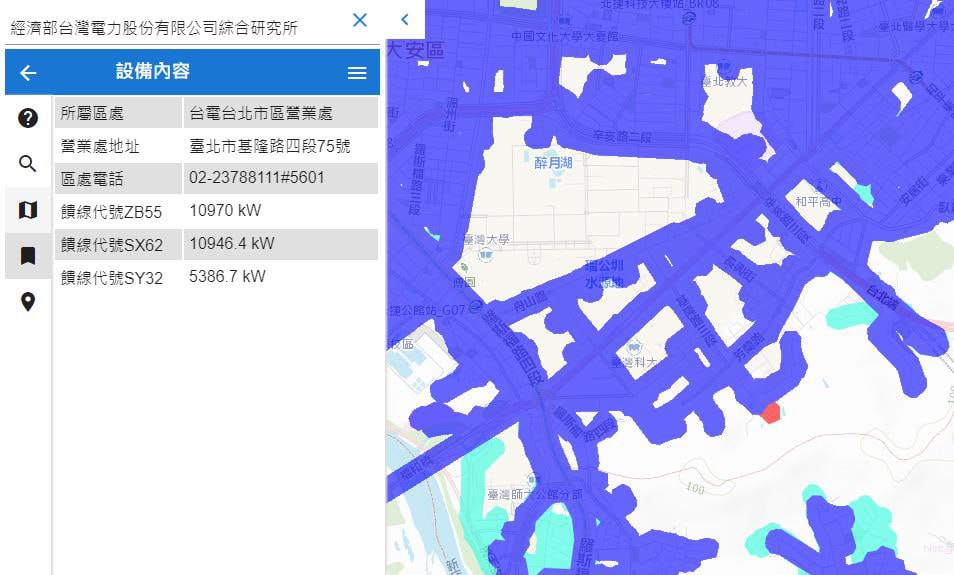
Fig6. System description and notices
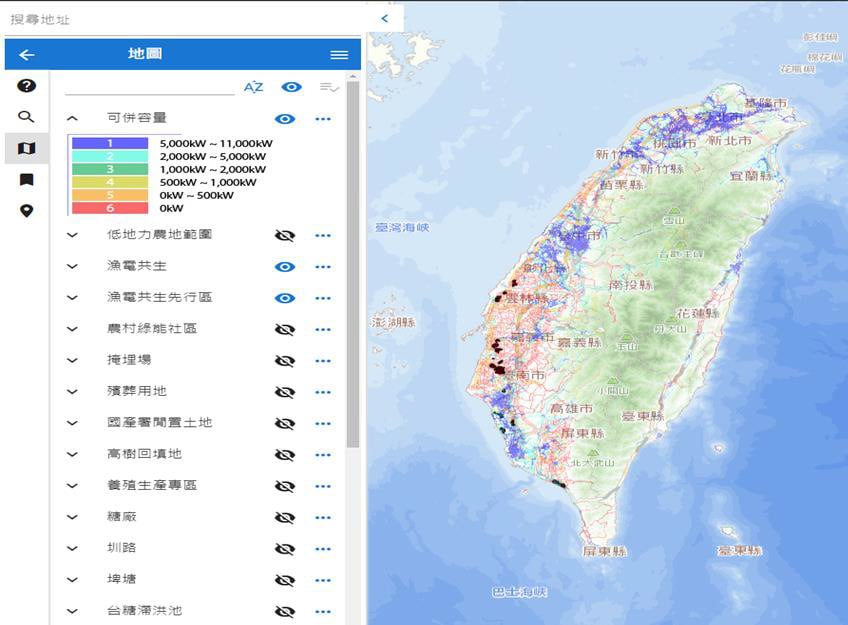
Fig7.Legend and layer switch
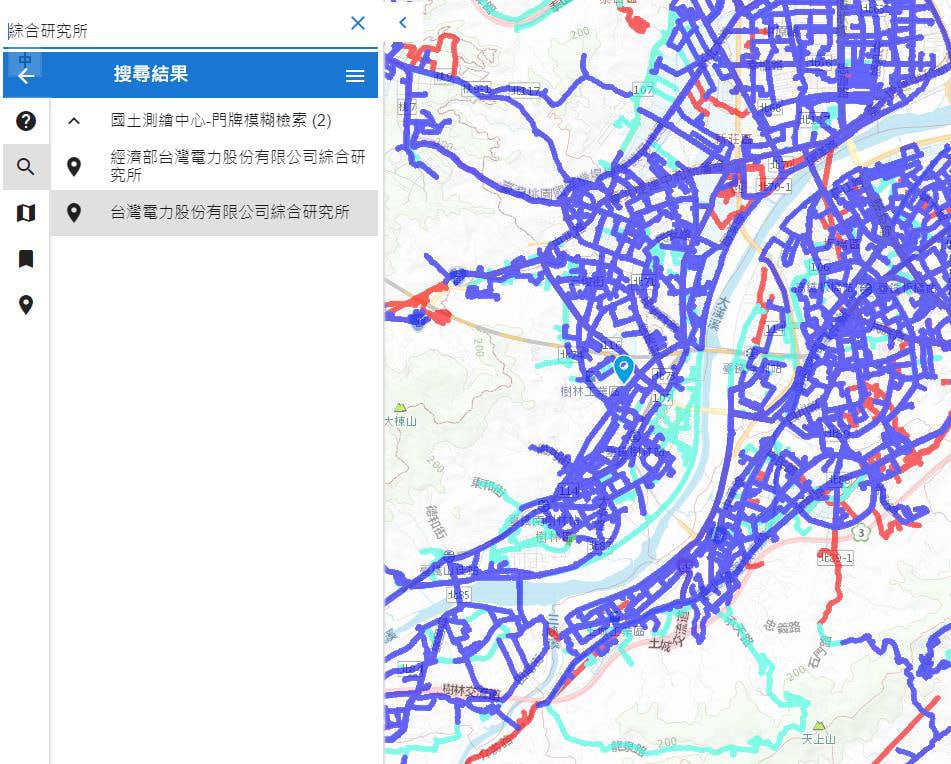
Fig8. Feeder information