1. Service Description
The TPC e-Bill service with simple registration and customer number setting has been provided to TPC users for quick inquiry of power consumption data and easy bill management. It is presented via easy-to-understand electronic interface and micro-animation such that users can have quick access to bill related information to facilitate the self-management of amount power consumption behavior and to achieve the energy saving effect.
The main visualization design of the front page is based on the illustration style with the layouts of four seasons. And there are the renewable energy subjects of wind power, solar energy, and hydraulic power generation to attract users to TPC e-Bill service in order to achieve the goal of paper reduction and environmental protection.

1. Figure 1 Front page main visual design (Spring)
2. Figure 2 Front page main visual design (Summer)
3. Figure 3 Front page main visual design (Fall)
4. Figure 4 Front page main visual design (Winter)
2. Function Description
General User
“General User” can have access to the website related information including payment status enquiry, bill pre-estimate, website tutorial, FAQ, and news.
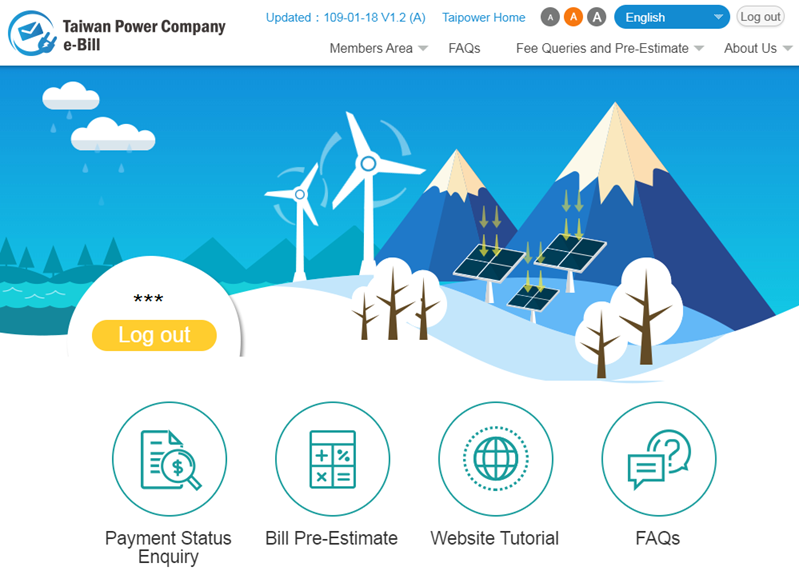
Figure 5 Front page of TPC e-Bill serviceMembers
Users can register to become the “Member” of TPC e-Bill service. In addition to periodic bill notification and payment certificate in the form of email, users can also have access to historical bill data.
A member could login the TPC e-Bill service to have access to the functions of basic information management, bill inquiry, and analysis of amount consumption chart. To make the operation easily, the bill information of all registered customer numbers will
be listed on the login screen, and the provided functions are the latest monthly bill, total amount, payment status, the payment barcode to be downloaded (the unpaid bill can be directly downloaded), re-sending of electronic notification, and historical data.
3. AMI Real-Time Inquiry
To facilitate the real-time inquiry of amount consumption data by AMI smart meter users and thus promoting the power consumption management, the “AMI Area” icon behind the customer number of AMI could be selected to enter the AMI dashboard function, which provides various functions such as comparison of various real-time amount consumption data, self-defined upper limit of amount consumption, analysis of amount consumption statistical chart, and rate service evaluation.
Note: Users could enquire real-time amount consumption data of the previous day by noon.
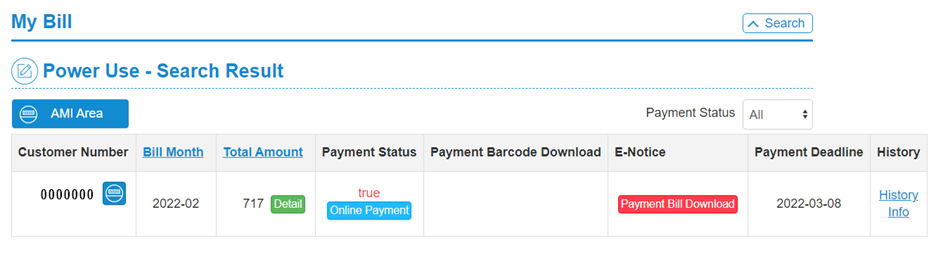
Figure 6 My Bill
The percentage comparison of total AMI amount consumption and total amount trend
The percentage comparison of total AMI amount consumption of current year and last year will be shown on the indicator dashboard. The monthly power consumption trend for the two years next to the dashboard to directly compare whether the total consumption has increased or decreased.
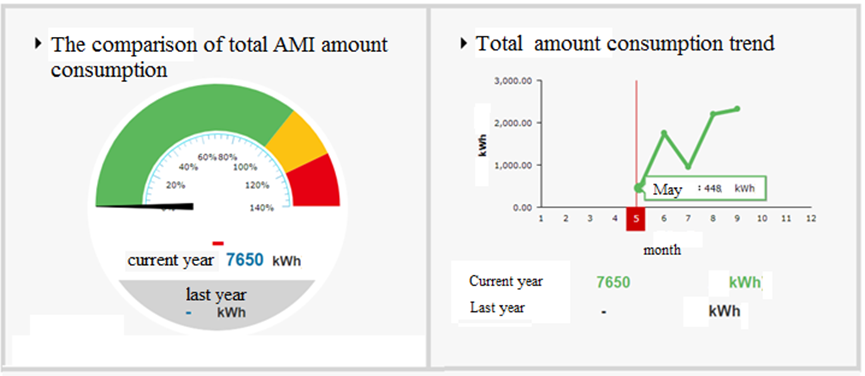
Figure 7 The percentage comparison of total AMI amount consumption and total amount trend
The users could check their own total consumption and the average power consumption in the same area or industry. And it would provide different contents via different scenarios to guide users to change their energy consumption behaviors.
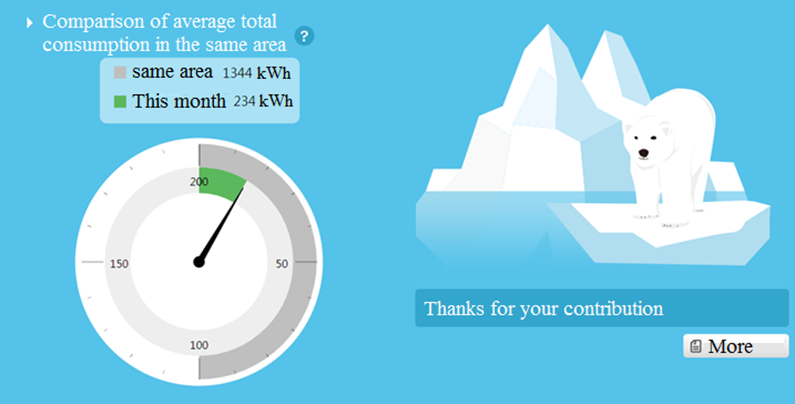
Figure 8 Comparison of average total consumption in the same area/industry
Setting Daily Power Limit
Provide users with the ability to set the upper limit of daily electricity consumption. When the electricity consumption exceeds the self-set degree, the user will be notified by email.
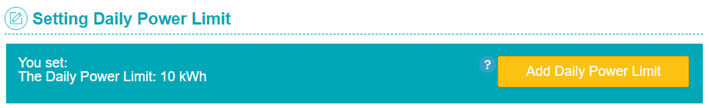
Figure 9 Self-defined amount consumption upper limit and abnormality notification
Carbon Emission
According to whether the amount consumption exceeds the “ average total consumption in the same area “ or “ Self-defined amount consumption upper limit “, the icons of carbon emission and trees are provided to strengthen the connection between amount consumption and energy saving.
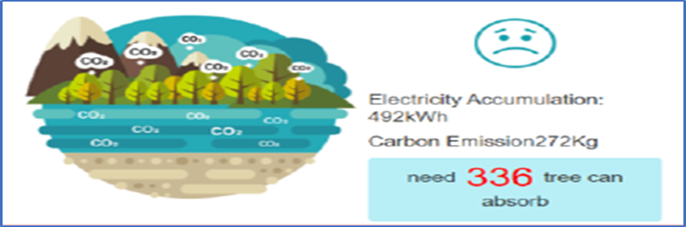
Figure 10 Carbon Emission
Monthly Consumption
The total amount consumptions of all months are presented and compared in the form of monthly pie chart, and different colors (green, yellow, red) are used to show whether or not it is increased as compared to the base month.
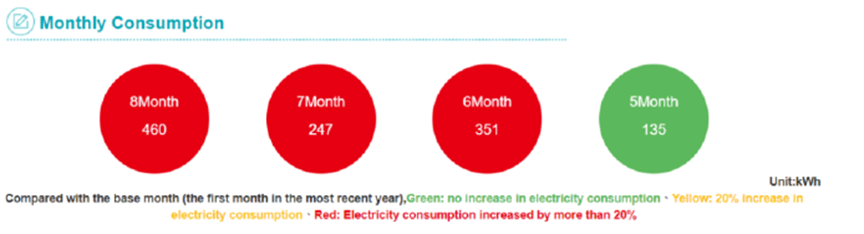
Figure 11 Monthly Consumption
AMI Statistics
The real-time and detailed AMI amount consumption charts are presented in graphics to shown the statistics based on “year”, “month, “day”, “15 minutes”, and the daily (24 hours) comparison.
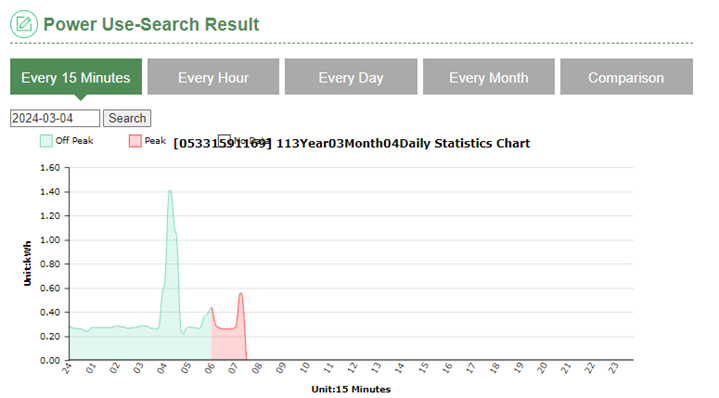
Figure 12 AMI real-time statistical chart
Rate Suggestion Pre-estimate
The trial calculation comparison amount of simple rate plan is provided according to the past AMI real-time amount consumption information of users to help users assess which rate plans are more appropriate according to their energy consumption habits.
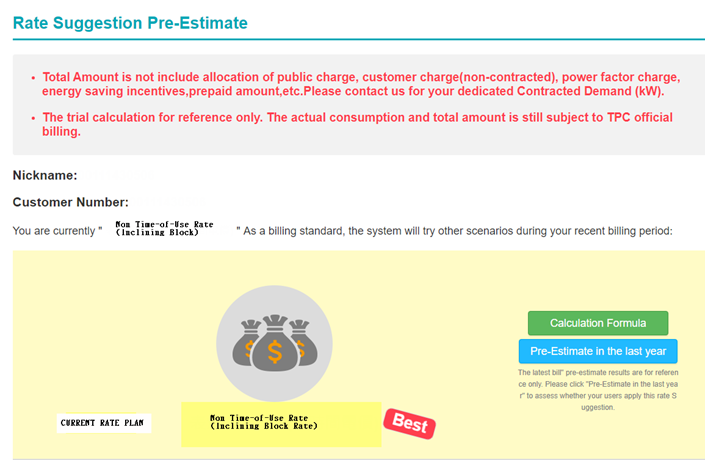
Figure 13 Rate Suggestion Pre-estimate
Unbilled Electricity Bill Amount Estimate
According to the past AMI real-time amount consumption information of users, we provide the estimate of the unbilled power consumption and the bill amount to help users control electricity usage
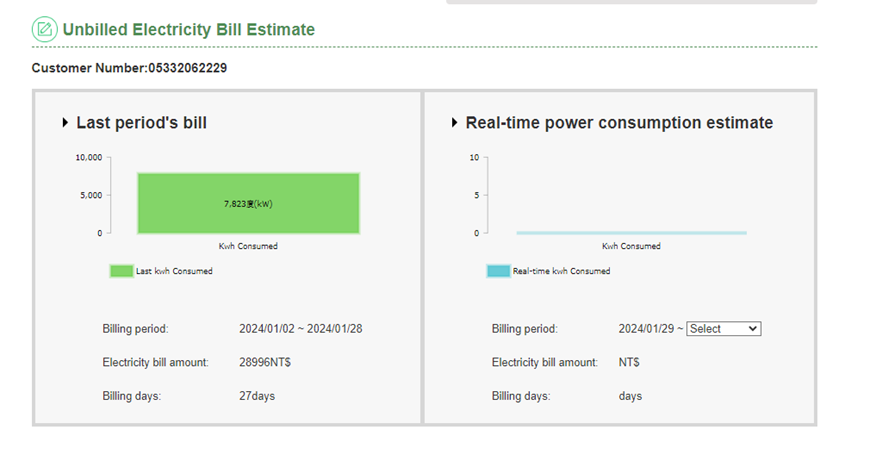
Figure 14 Unbilled Electricity Bill Estimate
Amount consumption analysis chart
Users are provided with the power consumption charts of recent 48 hours for comparative analysis with the same timeframe of last week and last month.
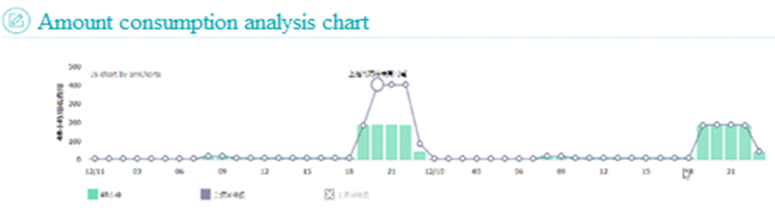
Figure 15 Amount consumption analysis chart
Maximum Demand Alert
If the Maximum Demand(kw) exceeds 95% of the Contracted Capacity(kw), the user will receive reminder email, which remind user to avoid Customer Charge(Non-Contracted) fee.
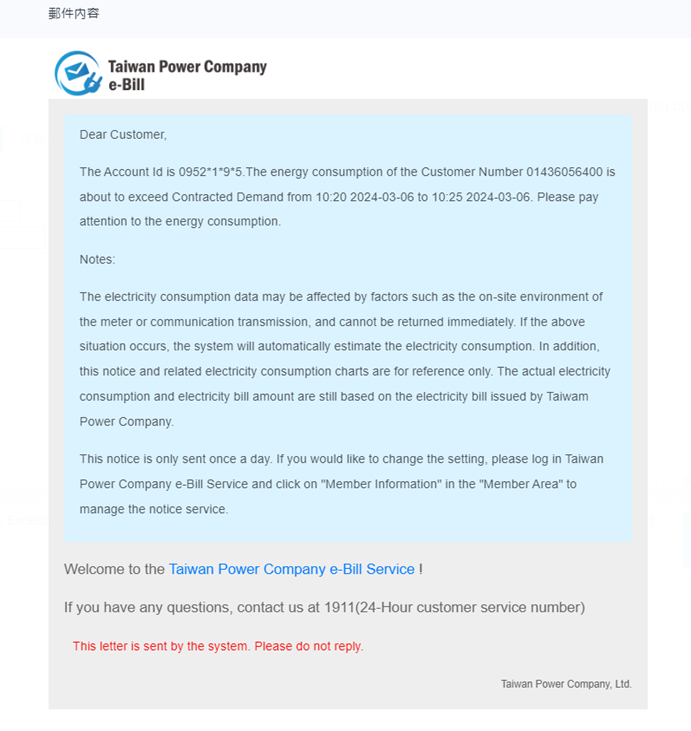
Figure 16 Contents of notification letter
4. Future planning
Enhancement of interactive design
We will continue enhancing the interactive service for users, and simplify operation interface and enhance the friendliness of website by user friendly and dynamic guidance approach in order to enhance users’ willingness of registration and use while achieving the energy saving efficiency of all people.Increase of comparison data
In order to enhance the advocacy of energy saving awareness and the mentality of comparison and competition, users will be provided with bases of different targets of comparison to achieve the objective of user’s voluntary power saving and to greatly enhance the energy saving effectiveness.Continue to integrate member accounts with Taiwan Power APP
Allow users to use services on various platforms of TPC through a single set of account passwords.