AMI Deployment
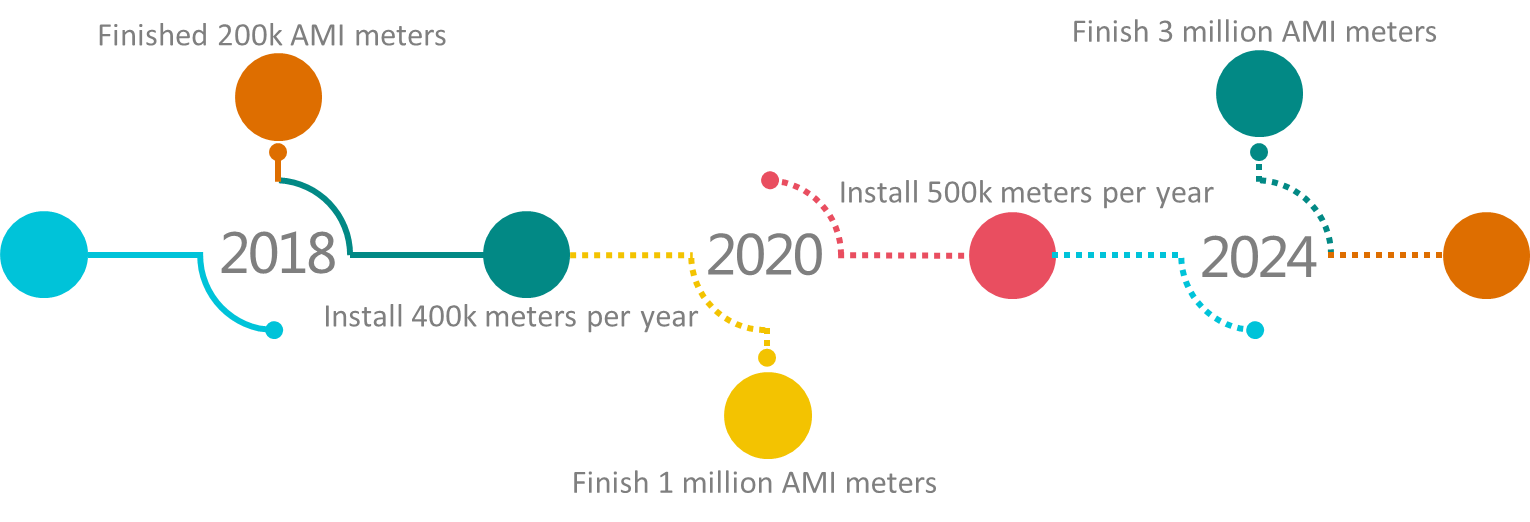
Taipower has installed AMI meters for large (all extra-high-voltage and high-voltage) customers in 2013. The load structure of Taiwan's power system is mainly composed of large-scale (high-voltage) industrial and commercial users, and their power consumption is about 60%. For small (low-voltage) customers, Taipower plans to install up to two hundred thousand, one million and three million , and six million AMI meters in 2018, 2020 and 2024 , and 2030 respectively. The schedule was approved by Executive Yuan on February 18, 2017.
There are more than 15 million electricity customers supplied by Taipower. Even if finishing 3 million small customers’ AMI deployment in 2024, the penetration of AMI users is only about 21%. However, the power usage of large-scale customers with installed AMI are about 60%, after finishing 3 million customers’ AMI deployment in 2024, Taipower could handle around 81% of power usage information of Taiwan’s power system. In the future, Taipower will be able to install 6 million AMI and handle around 85% of power usage information of Taiwan’s power system in 2030.
Deployment Schedule
Taipower conducted low voltage AMI smart meter deployment via separate tendering of meter, communication, and meter data management system. The current status of deployment is as shown below:
-
Meter
The procurement of 200,000 units of low voltage AMI smart meters was completed in 2017. The accumulated installation of 230 thousand smart meters was completed in 2018 and 3.4 million smart meters in 2024. Last year Taipower has deployed about 4.1 million smart meters for commercial and residential customers, which occupies about 82.4% of all customers' power usage in Taiwan. -
Communication module
The procurement of 200 thousand units of communication modules was completed in July 2018. The installation of 230 thousand communication modules was completed in March 2019. In 2025, we have installed about 4 million communication modules. The total system connection rate between MDMS and smart meter is over 97.6%. -
Metering data management system
Metering data management system (MDMS) has been on-line system in 2020, and it can successfully collect and manage 4.5 million meters data.
MDMS Data Interfaces & Service Applications
Along with the schedule of AMI deployment, Taipower is planning to construct a MDMS (Meter Data Management System) which can accommodate with some millions of customers’ AMI data.
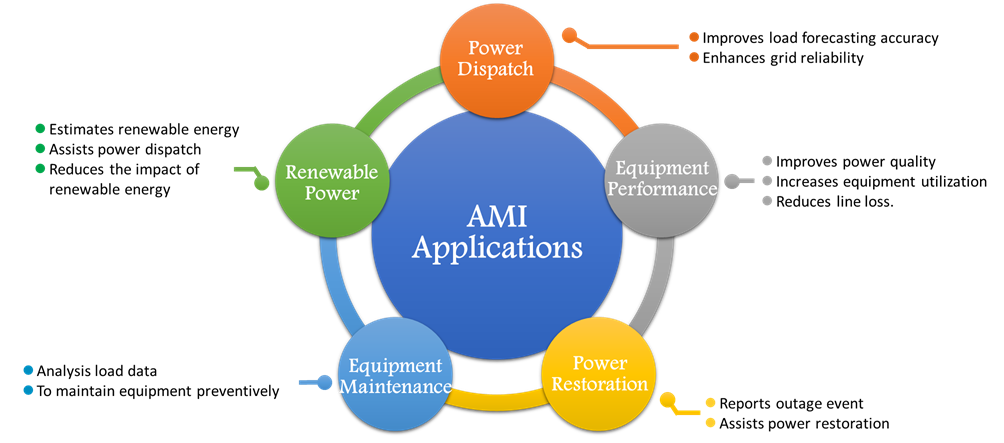
MDMS is extremely important in the architecture of AMI. It should be able to offer processed data, which is consistent and can be directly used by other applications, to make sure the applications can be integrated on the same basis. The repetitive data pre-processing work (ETL, Extract-Transform-Load) can also be avoided. MDMS can help earn valuable application by providing good data, related application such as power dispatch, renewable energy, equipment performance, equipment maintenance and power restoration, shown as figure below.
Achievements
The section below will highlight some key subjects/items of research and development group as examples to illustrate the application contents of the plan. Every other application subject/item within the framework have been assigned to responsible departments for the administration, which are regularly tracked and controlled.
-
xEMS (Community, Building, and Home Energy Management System)
xEMS is the concept of energy management in the area of community, building, and home, which also known as CEMS, BEMS, and HEMS, respectively.1.1 CEMS (Community Energy Management System)
The introduction of CEMS can help to manage the energy usage inside a community effectively. With measuring and monitoring the instant power load for every responsible area, the system can calculate reduced demand potential immediately within the community to support overall load management and operation.1.2 BEMS (Building Energy Management System)
BEMS focuses on the power management inside each building. With checking the electrical loops and equipment inventory in the building, measurement and control elements are installed to master the real-time electricity usage. Besides, with the participation in DR programs of Taipower, users can reduce the peak load and get further rewards.1.3 HEMS (Home Energy Management System)
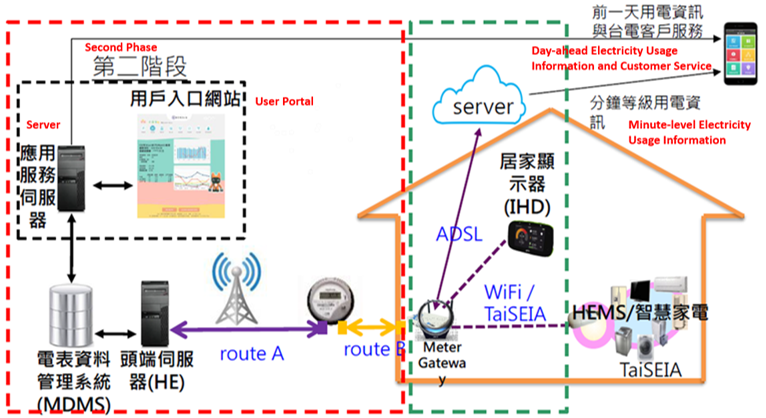
HEMS assists home members to master the electricity use inside the home. With the communication network technology, integration of AMI and HEMS and connection with energy-saving household appliances, HEMS can provide instant power usage information, manage and control appliances by intelligent schedule, analyze the power usage status on smart home platform, perform demand response request and energy management service functions.
-
Electricity Usage Pattern Indicator
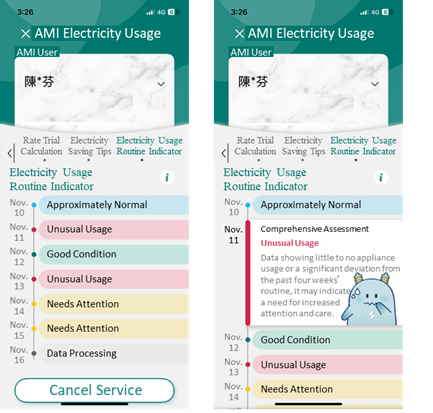
As Taiwan’s aging population continues growing, challenges of aging society is increasing. Based on caring for the elderly who do not live together, we have developed the “Electricity Usage Pattern Indicator” using AMI (Advanced Metering Infrastructure) data which record every 15 minutes electricity consumption, allowing real-time monitoring of household electricity usage. By analyzing AMI data to derive customers’ electricity usage patterns, we can detect unusual status according to their electricity usage routine patterns and provide information for reference in real time. This application is launched in March 2025 on the Taipower APP for free.
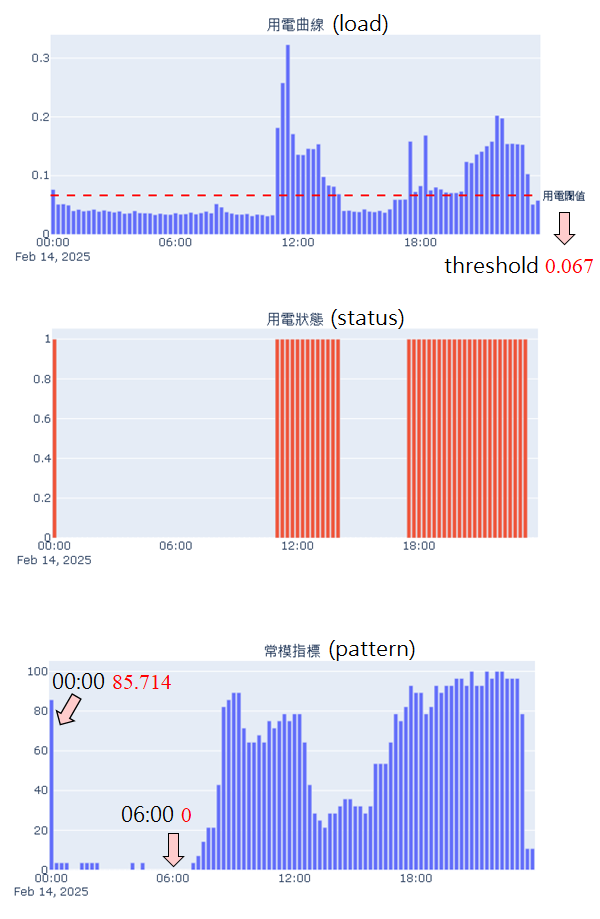
At the beginning, we find an electricity consumption threshold of each user based on past 28 days AMI data, then compare electricity consumption with the threshold. If the load exceeds the threshold, the status is set to 1. If the load is lower than the threshold, the status is set to 0. Next, summary status to derive patterns. For example, at the time point of 00:00, average status of the past 28 days. We can derive that the customer has around 85% chance using electrical appliance during 00:00 to 01:00. On the other hand, this customer never uses electrical appliances at 06:00 during the past 28 days. With the derived patterns, we can provide electricity usage information to customers to enhance communication between families.
Open Data Platform of Government and Taipower
As of April 9, 2026, Taipower has 186 Datasets available on the open data platform for downloading and use by the public. In accordance with the Ministry of Economic Affairs' data openness promotion strategy and set goals, Taipower regularly takes stock of business data and evaluates the demand for external data from time to time on the basis of the three principles of non-openness, including personal data privacy, business secrets, and national social security. After structuring, de-identifying, and passing data quality checks, we will promote the diversification of data applications and their scope of application and open them to the public in open formats or APIs to create higher value in the electricity market together with the public.
Grid-related Data Analysis Projects
Real-Time Damage Monitoring System
-
Abstract
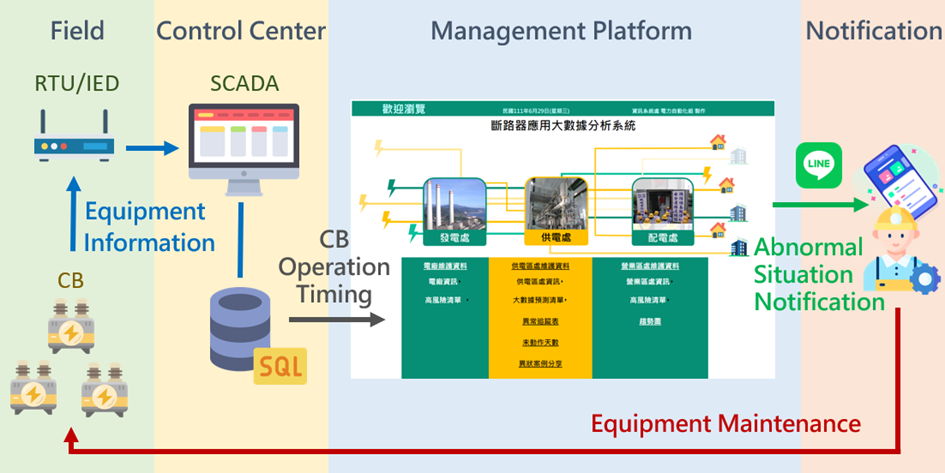
In 2014, Taipower began using Intelligent Electronic Device (IED) operation information from Remote Terminal Units (RTU) and IEC 61850 substations as trigger signals for calculating the Sequence of Events (SOE) times for auxiliary switches from circuit breakers. An online circuit breaker inquiry system was then established, and more than 830,000 pieces of information have been accumulated so far. In 2018, AI big data analysis was introduced using equipment brand, age of use and past operation timing. This led to the successful diagnosis of 410 abnormal circuit breakers, particularly those with dull or delayed mechanisms. The prediction accuracy rate reached 30%.
In 2021, the median number of the close/open operation timing was used as the diagnostic standard and the construction of IEC61850 standard substations was promoted. This will effectively improve accuracy by 40% and result in the successful diagnosis of 70% more abnormal circuit breakers.
To allow for ongoing status monitoring, a web-based management platform and an notification app were developed. When a circuit breaker experiences an abnormal operation, the system will immediately notify maintenance personnel so that the issue can be resolved quickly. This greatly improves the security of the power grid.
-
Big Data Statistical Analysis of Online Circuit Breaker Operation Timing
The operating times for circuit breaker that was obtained through the RTU/IED triggered SOE information technology (see above) varies depending on the sampling circuit and the auxiliary switch of the operating link. According to analysis, performed using the AI big data XGBOOST model, under normal circumstances the close/open operation timing is less than 5ms regardless of whether the circuit breaker is closed or open. Consequently, the median number of the close/open operation timing was introduced in 2021 as the diagnostic standard, allowing for greatly shortened AI big data analysis times.
-
Construction management platform and practical application results
The large database of circuit breaker operation times was combined with data management functions to build a management platform. This platform allows for the reporting of abnormalities in real-time and issues notifications via app. This quickly alerts maintenance personnel and appraises them of the situation so that maintenance can quickly be arranged in accordance with the problematic equipment’s operational trends, brand, type and use history.
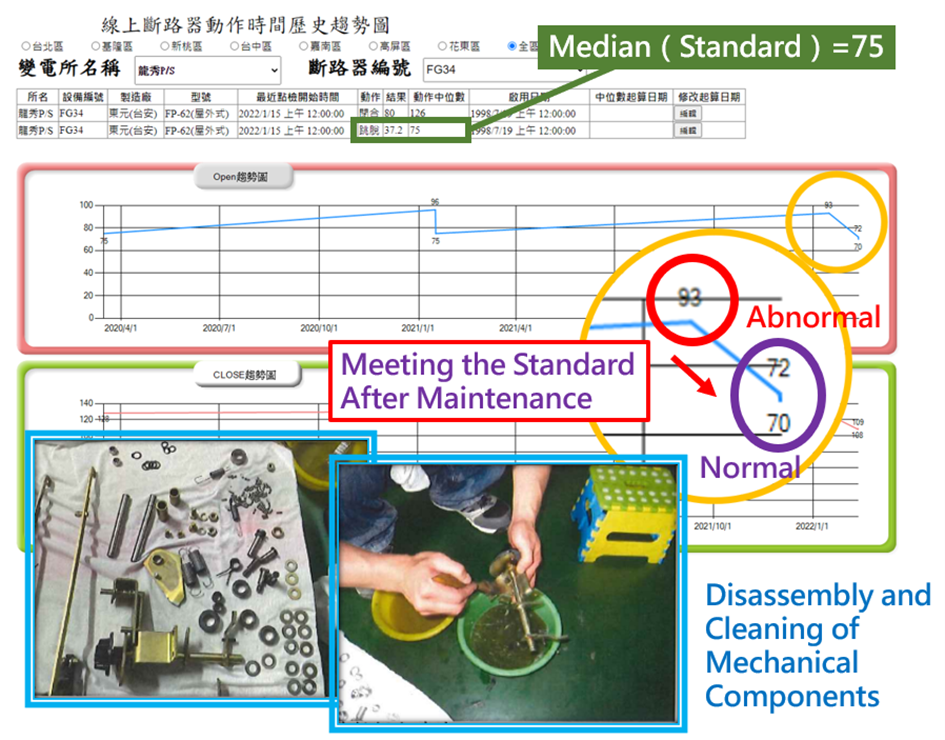
At the time of writing, 223 circuit breakers with institutional exception have been diagnosed and processed.


Real-Time Damage Monitoring System
-
Introduction
Nowadays, in response to the booming use of renewable energy, smart power generation has played an important role. Taipower is actively seeking various test fields to develop a new generation of smart power generation, including Boiler Monitoring and Diagnostic Platform for Unit 5 ~ 10 of Taichung Power plant. The more intelligent power generation applications we use, the better power service and stability we can provide.
-
Real-Time Damage Monitoring System
In the past, Taichung Power Plant experienced several boiler tube breakage accidents, which caused the power supply system in a critical situation. Consequently, Taipower develop a monitoring and diagnostic platform for Unit 5~10 of Taichung Power Plant last year. With this pilot project, we provide an innovative approach which achieves predictive maintenance furnace to smart power generation.
-
2.1 Structure and Features of Taichung No. 5 ~ 10 Boiler Monitoring and Diagnostic Platform
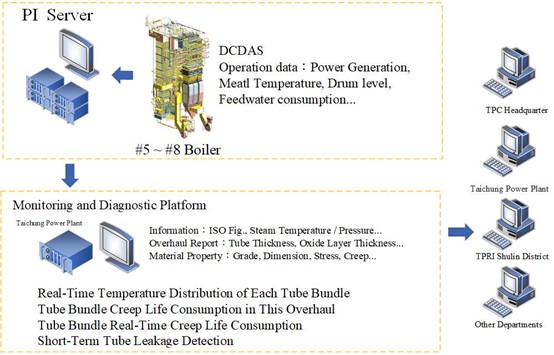
The real-time operation data is transmitted to the Pi server for storage through the No. 5 ~ 10 DCDAS system, and the Pi server transmits the real-time operation data to the No. 5 ~ 10 online monitoring and diagnostic platform for storage and calculation. Colleagues refer the analysis results of the platform. The main features are as follows:
◆ Access the real-time operation data of Pi Server to the monitoring and diagnostic platform for analysis and calculation. Evaluate the difference between the each metal temperature of tube bundle on creep deterioration trend. Observe the creep deterioration effect of high-temperature and high-pressure long term operation on the tube bundle.
◆ Through the overhaul report of the oxide layer measurement data, evaluate the influence of the tube deterioration in the past two years of operation. Taipower observe where the tube bundle weaknesses are. Currently, the furnace tube assessment for Units #10, #8, and #5 is underway.
◆ Monitor boiler feedwater consumption and hotwell level changes by analyzing daily operation data. Observe the signals of short-term tube leakage and expect to make a notice.
◆ Self-developed coding and planning monitoring and diagnostic platform to build up research capacity.
-
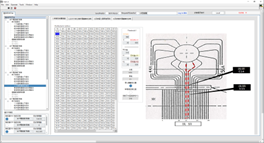
2.2 Interface of Monitoring and Diagnostic Platform
The system flow chart and function interface are shown in the figure below:
System Structure
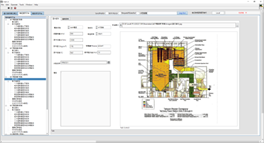
System Interface
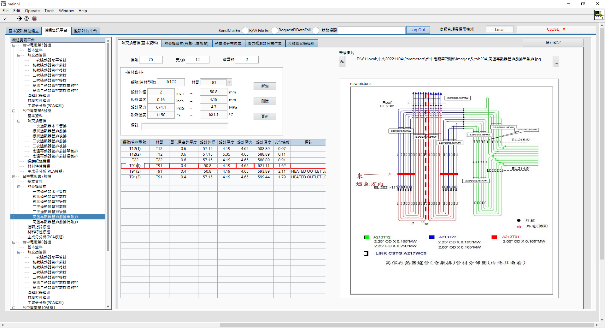
Tube Bundle Layout
Operation Data
Metal Temperature Arrangement
Real-Time Metal Temperature Display
Overhaul Oxide Layer Data
Overhaul Tube Bundle Creep Life
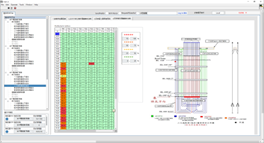
Real-Time Tube Bundle Creep Life
Monitor Feedwater Level Trends
Platform Analysis Report
-
2.3 Verify the accuracy of the system
During the overhaul of Unit 5 ~10 of Taichung Power plant, the results of the furnace tube damage detection has been inspected according to the location of the damage on the Boiler Monitoring and Diagnostic Platform for Unit 5 ~ 10 of Taichung Power plant to verify the accuracy of it. Currently, the evaluation of boiler tube materials for Units #10, #8, and #5 is underway. The optimum parameter, correction and maintenance Boiler Monitoring and Diagnostic Platform for Unit 5 ~ 10 of Taichung Power plant are continuously carried out.
-
2.1 Structure and Features of Taichung No. 5 ~ 10 Boiler Monitoring and Diagnostic Platform
-
Achievements and Prospects
Taipower built monitoring and diagnostic platform for the Taichung No. 5 ~ 10 boiler. Conducting the annual overhaul report and the real-time operation data, monitor and observe the creep damage and feedwater trend of the tube bundle under high temperature and high pressure operation for a long time. System can detect the possibility of tube leakage to reduce the probability of unexpected shutdown and promote the reliability of power supply.


Green Energy Estimate Monitor System (GEMS)
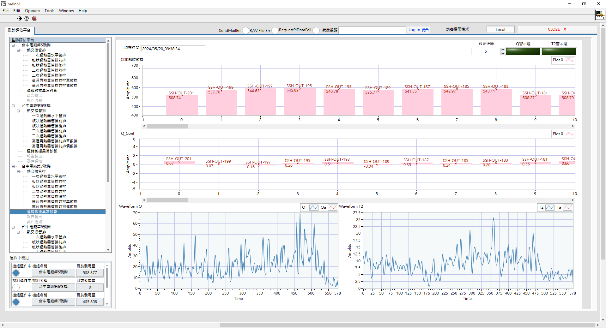
Taiwan has a maritime island climate, characterized by distinct seasons and frequent afternoon thunderstorms. These weather patterns significantly impact solar photovoltaic (PV) power generation. To quickly detect deviations between actual PV power output and predicted values, visualizations are essential.
Therefore, on the existing Green Energy Estimate Monitor System (GEMS),a new solar photovoltaic standard deviation feature has been developed.It incorporates the concept of standard deviation mathematical models and utilizes historical and current solar photovoltaic generation data. The system calculates the average hourly power generation and the hourly variation in power generation (as indicated by the gray and black dotted lines in the diagram). It then presents the variation by adding or subtracting 1.64 times the standard deviation to create upper and lower trajectories (shown as Indigo dotted lines). Additionally, the standard deviation of historical hourly power generation variations is represented by a purple translucent area as the range interval.
Finally, real-time monitoring of half-hourly power generation fluctuations (depicted by the deeppink bars) is normalized (multiplied by 2) to swiftly reflect the current situation.
After analyzing the historical data, it is recommended to use a 60-day window to effectively represent the deviation. The design of the solar photovoltaic standard deviation tool has a physical significance. This calculates the variation in solar photovoltaic generation for each hour over the past 60 days. The hourly fluctuations in solar photovoltaic generation on a given day have a 90% probability of falling within the standard deviation range. This can serve as a reference for preparing fast responsive reserve units to be used during climate transitions. By anticipating the rapid changes in solar photovoltaic generation caused by seasonal shifts, we can better respond to these fluctuations.
The Building and Application of IEC 61850
-
The building of IEC 61850
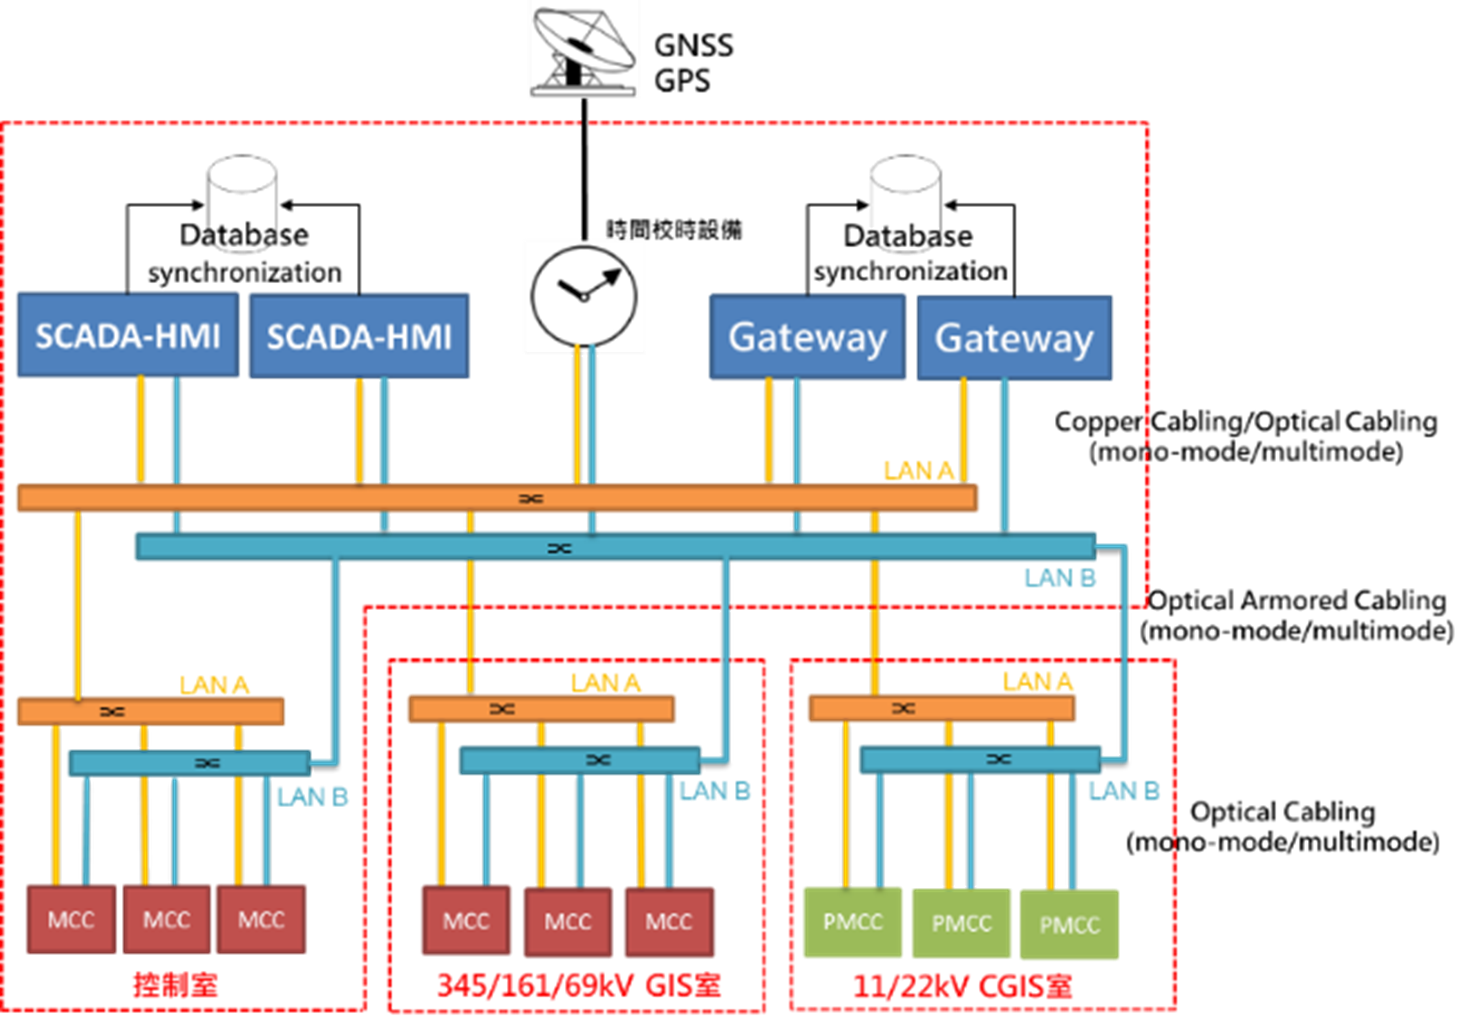
At present, nearly 90% of the substation automation monitoring architecture adopt remote terminal units (RTUs), and most of the power meters, IEDs and RTUs use communication protocol DNP3.0. The monitoring architecture of the other substations adopt Local SCADA and gateway. The communication protocols between the gateways and IEDs are different (Modbus, DNP, LON, Profibus, etc.). The main function of these two substation automation methods is updating the real-time operation information in substation to the control center for dispatching (vertical communication), while the information cannot be exchanged horizontally between substations.
The full name of the IEC 61850 standard is "Communication networks and systems for power utility automation." The latest version, Edition 2, is an internationally accepted power automation standard that conforms to the future development trend of smart grids. Its main purpose is to provide the interoperability between different brands of IEDs.
In addition, the substation automation following the IEC 61850 monitoring architecture is also beneficial for the improvement of the reliability of power supply. This architecture provides a platform for horizontal communication (GOOSE) of automated equipment in the substation, enabling various equipment that enables to complete the application scenario of protection and operation in power system.
-
GOOSE Application of Simultaneous Accidents between Two Feeder Lines in compliant with IEC61850 Substation
-
A. Abstract
The application of smart grids in the field of power transmission and transformation is mainly on the construction of substation automation based on the internationally accepted IEC 61850 standard. Intelligent electronic devices (IED) are the basic elements of digital automation substations, providing the protection, measurement, control and communication functions required by the system, and the GOOSE function which transmit events fast is used to transmit important instantaneous command signals between multiple IEDs. For this reason, the digital network communication is the substitute for the hard-wired control loop between traditional devices to achieve IEDs interoperability. In order to solve the problem of protection coordination difficulty caused by the simultaneous failure of the common feeders, which caused cross-zone tripping, the GOOSE information can be used to detect the IED trip protection logic to speed up feeder tripping, which strengthen the protection coordination between upstream IEDs and downstream IEDs, speed up the IED tripping on fault feeder to isolate the fault and reduce the scope of power failure.
-
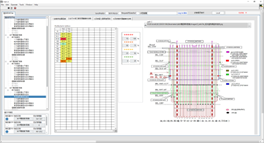
B. Construction
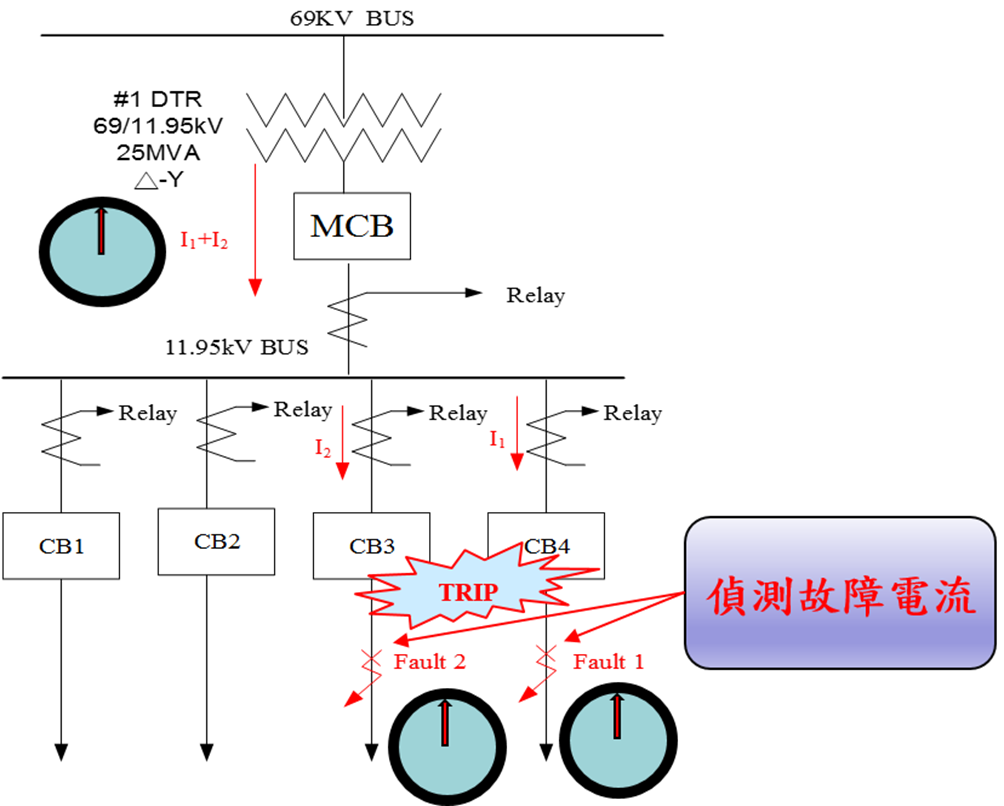
Taking the 11.95kV BUS devices in the following figure as an example, there are MCB, CB1, CB2, CB3, and CB4, five circuit breakers. Among them, the CB1, CB2, CB3, and CB4 are feeder circuit breakers, and their IEDs planning GOOSE command accelerates CB tripping.
-
> Logical summary description:
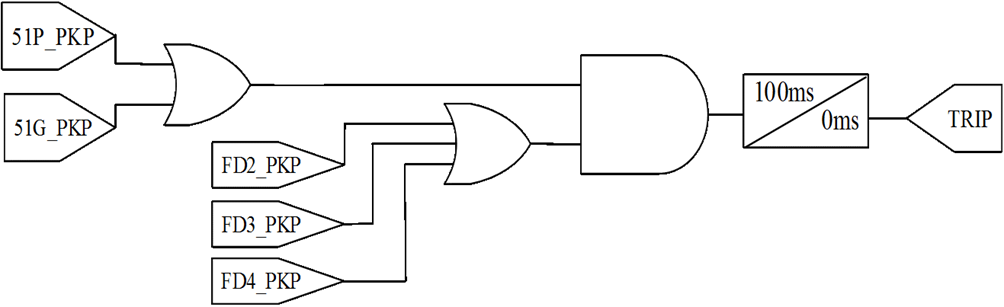
When any two feeders have a fault current at the same time, the two feeders will speed up immediately after judging the 6-cycle stable delay (you don't need to wait for the 51 / 51N relay delay-end and tripping). It can avoid simultaneous failure of the two feeders’ fault current smaller than the fault situation of a single feeder that makes 51 / 51N relay take a long time to operate, which causes the MCB's 51 / 51N action to trip. The relevant logic plan is as follows:
GOOSE publisher:
FD1_PKP=51P_PKP OR 51G_PKPGOOSE subscriber:
FD2_PKP,FD3_PKP,FD4_PKP -
> Accelerated trip logic:
Once a fault occurs on the CB1 feeder, when the 51 / 51N relay pickup and the IED have received the pickup Goose signal from other feeders in the same bank, if more than two feeders fail at the same time, a large current will be generated in MAIN, causing MAIN's IED to start tripping, causing incorrect trips and expanding power outages.
In order to prevent this phenomenon, when two or more feeders fail at the same time, we use the GOOSE on the IEDs of each feeder to transfer the PKP to each IED on faulted feeder, determining that when the two feeders fail at the same time should be delayed and tripping after 6 cycles to prevent MAIN CB tripping due to large currents first, causing a power outage on the sound feeder.
-
> Logical summary description:
-
C. Benefit analysis
When more than two feeders have fault occurred at the same time, we accelerate the accidental feeder trip to avoid the action of the main circuit breaker, reducing the scope of power outages and improve the efficiency of power supply.
-
A. Abstract


Transformer Condition Monitoring
Base on power supply dispatch’s substation maintenance manual, TPRI’s oil test will be done every year unless fault or abnormal situation of transformer happens. It is impossible to know the internal fault situation of the transformer in advance if we cannot obtain the gas content of the oil in the transformer and the operating status of the equipment timely. Current DGA(Dissolved gas analysis, DGA) shows the total amount of gas, it is hard to know exactly the amount of each gas, and the high number of abnormalities and expensive maintenance makes it not economical.
To ensure operation safety and achieve preventive maintenance, Taipower planned to install DGA for power supply units and replace the existing combustible gas detection device from the total type to the component type. It can obtain the content of gas components (H2, CO, water content) in the oil and alarm information, and judge the health of the internal operation of the transformer through each gas trend chart as the basis for CBM. It is expected that the effectiveness of the staff can be increase, equipment failure and blackout time can be decrease and ensure stable power supply.
Besides DGA, planning of existing transformer oil gas monitoring, transformer equipment asset management, and artificial intelligence AI applied to the transformer operation and maintenance strategy expert system for horizontal information integration and database interface to further master the transformer operation situation. If the abnormal situation of transformer is analyzed correctly, power outage maintenance can be arranged in time to avoid unforeseen power outages caused by accident.
Replacing Transmission Towers with a Novel "Tower Wrapping replacement Method"
-
Abstract
Transmission towers are a vital element of the transmission system. However, natural environmental factors, such as wind and sun exposure, gradually corrode and damage tower structures over the years. Consequently, towers must periodically be replaced.
Old transmission towers are typically replaced in one of two common ways. In the first method, power is turned off in all transmission lines on the old tower. Lines are then switched to the new tower one by one. Unfortunately, this “power outage method” reduces system scheduling flexibility and increases operating risks. In the second method, temporary poles and lines are erected. This method requires additional land to accommodate temporary poles. It may be more difficult in some areas with poor land.
The "tower wrapping replacement method" proposed in this article solves the difficulties associated with both conventional replacement methods. It not only avoids the simultaneous power outage of transmission lines but can also be applied flexibly to any location. This method enables the power transmission system to accomplish the replacement of old transmission towers with the lowest possible impact.
-
Introduction to the Tower Wrapping Replacement Method
As the name suggests, the tower wrapping replacement method, installs the new tower around the outer side of the old transmission tower and gradually replaces it. The method entails the following steps (also outlined in Figure 1):
- [1] First, install new tower angle irons on the existing foundation of the old tower. Next, set up the new tower footings on the new angle irons. When power is turned off on the left side of the old tower, the left side of the new tower’s body is installed.
- [2] When power is restored to the left side of the old tower, power to the right side can be turned off. The right side of the new tower’s body can then be installed. Additionally, power lines can be moved to the right side of the new tower. Once the lines have been shifted, the old cross-arm can be removed from the right-side of the old tower.
- [3] A new cross-arm can be installed on the right-side of the tower. Wires can then be moved to the new cross arm.
- [4] When power is restored to the lines on the right-side of the tower, the power can again be cut to the left side of the tower. The lines from the old, left cross-arm can then be moved to the left-side of the tower body. After the lines are shifted, the old cross-arm can be removed from the left-side of the tower.
- [5] The new cross-arm can then be installed on the tower’s left side and power lines can be moved onto it.
- [6] Finally, the body of the old tower can be removed and power can be restored to the left-side of the new tower. This completes the replacement process.
-
Advantages and Prospects:
The greatest advantage of the Tower Wrapping Replacement Method, proposed here, is that it does not involve either simultaneous outages or land acquisition. During the replacement process, power lines on at least one side of the tower can maintain a continuous power supply. These features allow this method to greatly alleviate the above-mentioned difficulties while loosening the time and space constraints on the replacement of old transmission towers, thereby increasing the flexibility of maintenance work.
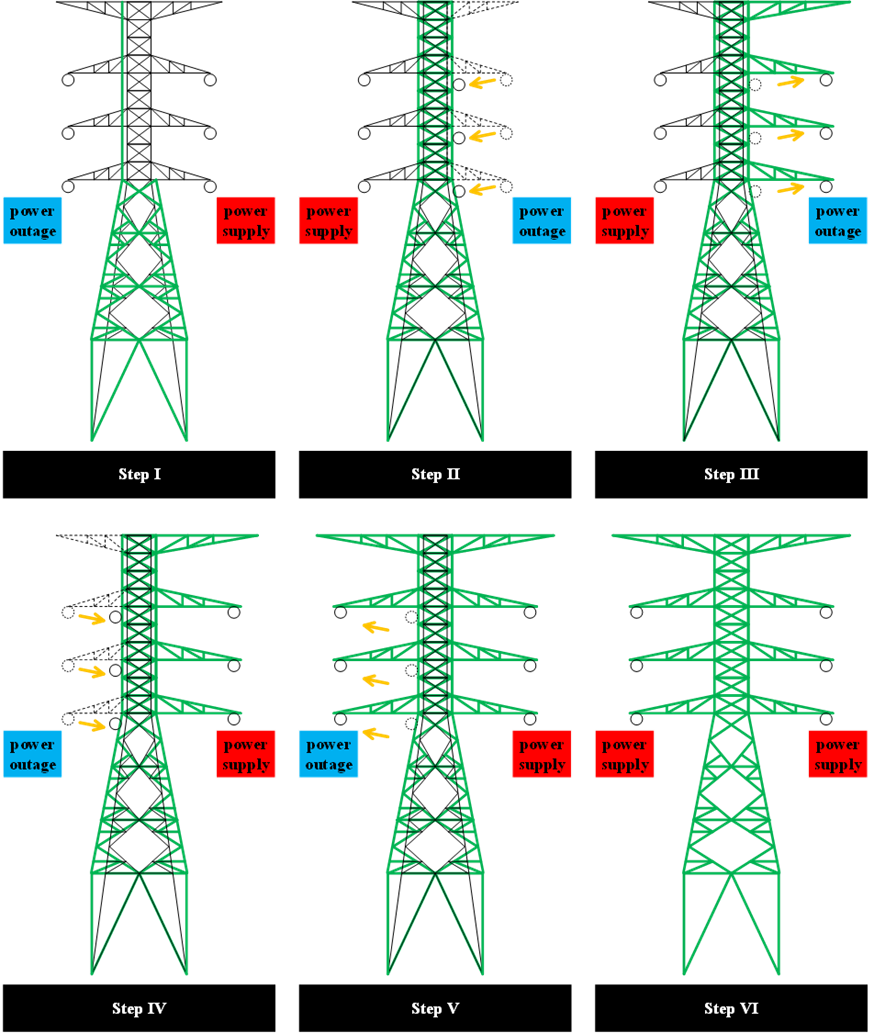
Figure 1 – The Tower Wrapping Replacement Method

Study for the feasibility of establishing early warning system disaster management with the real-time kinematic(RTK) in power supply units

-
Abstract
Taiwan is located on the Pacific Rim earthquake belt and the path of typhoons in summer. Therefore, natural disasters such as earthquakes and typhoons often occur. The mountain slopes are steep with rapid currents and the geology is fragile, causing natural disasters such as slope collapse, earth and rock flows, endanger the safety of transmission towers in mountainous areas. In response to the problem of power supply stability due to the sliding of tower foundation slopes by the extreme weather in recent years, the project applies fixed-type tilt meter and other slope monitoring instruments with real-time dynamic positioning system to 5 towers, including 345 kV Daguan, Mingtan - Fenglin line , #52, #68, #163, and 161 kV Fenglin Hualien Line # 76, # 77, for the construction of the tower-based slope disaster prevention early warning system and the application of real-time dynamic positioning assessment research. This project is to monitor target towers with the real-time kinematic, structural monitoring system, tower-based monitoring system and environmental monitoring system. The back-end management system provides an early warning function, and the warning signals of the monitoring equipment are displayed with lights in the tower-based monitoring management platform, so that tower maintenance managers access to cloud data through the user monitoring interface, and immediately grasp the status of the monitoring tower.
-
Method
The basic dynamic intelligent monitoring system of the tower includes four systems: power system, sensing system, communication system and data system analysis management. Taipower plan to use real-time kinematic, structure monitoring system, tower-based monitoring system and environmental monitoring system to formulate the sensing system for monitoring the target tower. The functions of each system are summarized as follows:
- [1] The real-time kinematic is based on high-precision 3D positioning data obtained from two GPS stations and one GPS fixed station set up around a single tower to monitor the long-term trend of the site of the tower.
- [2] The structure monitoring system is designed to understand the structural behavior and rigidity of the tower by means of the acceleration gauge, strain gauge and tilt meter set up in the base of the tower.
- [3] The tower-based monitoring system is set tiltmeter on the basis of the tower base to measure the change of the tower-based tilt and automatically measures the sliding deformation of the stratum by setting a fixed tiltmeter for comprehensively safety evaluation.
-
[4] The environmental monitoring system provides early warning for geo-slip analysis and slope-land disasters by using rain gauges, water pressure meters, anemometers and wind gauges to understand rainfall, wind speed, wind direction and monitoring of groundwater level changes.
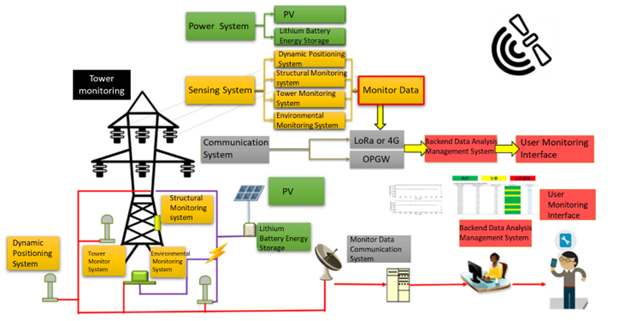
In addition, the sensing system require the power system to provide the power. This project uses the solar power generation system to supply the overall monitoring system power source, and establishes a stable power supply system, including lithium battery energy storage equipment, so that when the power is insufficient, the energy storage equipment can supply the power for communication at least 30 days. Monitoring data is transmitted through the communication system to the management platform. This project is evaluated to use reliable communication technology for the monitoring tower to the connection tower (with Taipower OPGW Joint Box tower) such as LoRa, 4G... and build its communication system, and carry out the communication test of photoelectric conversion.
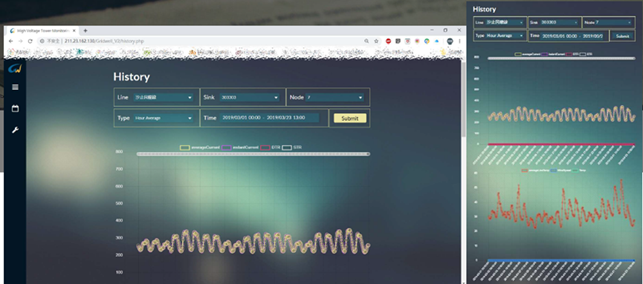
The data analysis management system is the processing center for all monitoring data. Taipower can get complete and long-term monitoring data, real-time monitoring of geodetic displacement, structural displacement, and water level observation, and analyze whether relevant real-time data exceeds the safety alert value. This system will provide an early warning after data is analyzed. The warning signal of the monitoring equipment is displayed on the tower-based monitoring and management platform, so that the field personnel can obtain cloud data through the user monitoring interface, and immediately grasp the status of the monitoring tower.
-
Projects objectives and benefits
The objective of this project is to establish a long-term monitoring system for the target tower, to grasp the structure of the tower and the situation and development of land shift, and to provide reference for the maintenance, power operation and disaster early warning. Accordingly, the project intends to carry out the construction of local power systems, communication systems, monitoring instruments, and the development of monitoring webpages for 5 monitoring towers, with the following objectives:
- [1] Establishment of sensing systems real-time kinematic, structure monitoring, tower-based monitoring, environmental monitoring).
- [2] Establish a power system (solar power generation, lithium battery storage equipment).
- [3] Establish communication system (LORA, OPGW).
- [4] Establish a monitoring data management system.
- [5] Develop a follow-up proposal for improvement and a suitable tower monitoring system for Taiwan Power Corporation.
This project envisages the establishment of the basic dynamic intelligent monitoring system of the tower and achieves the following results.
- [1] Establish an independent power supply system to solve the power supply problem of the tower monitoring equipment.
- [2] Establish an intelligent monitoring system to assist the inspection, maintenance and management of the tower.
- [3] The monitoring numerical big data database of geological environment and structural security of the domestic tower is established to provide the alert analysis of the back-end platform.
- [4] Establish the domestic tower contingency decision-making process to improve the stability and reliability of existing power supply system.

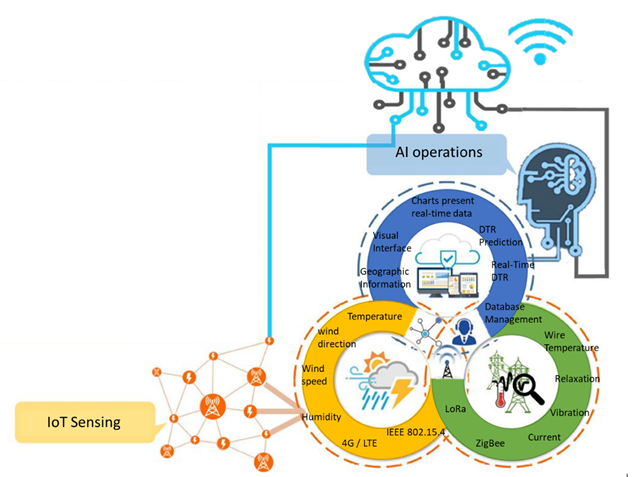
Research on the Advancement and Integration of Dynamic Thermal Rating System
-
Abstract
In order to realize the smart transmission plan, this project investigate the method of increasing the transmission capacity. According to the power associations in the world, including the IEEE, JCS, and CIGRE, the relevant standards are formulated based on heat equation of conductor. The dynamic thermal rating (DTR) method is proposed to effectively increase the transmission capacity with real-time data. The project studied DTR according to the plan requirement. The contents before the first mid-term report have five points. 1. Compare and explore DTR and static thermal rating (STR). 2. Discuss DTR formula and parameter. 3. Collect relevant DRT research and application of foreign electric industry and manufacturers. 4. Design and Verify IoT technology introduced into high voltage system. 5.Design and verify DTR equipment.
This study is a practical application of DTR. In addition to data collection, performing high-voltage and high-current tests are also necessary on DTR equipment to test and prove the reliability and stability of the equipment, which is conducive to subsequent research in the line installation under the supervision of operators and equipment. This will help to understand the actual state of the line after capacity increase and accumulate the experience of using DTR to improve capacity operation. In the future, it can further modify the power dispatching and power transmission specification.
-
Content and method
-
[1] Dynamic thermal rating equipment and small weather stations with wireless communication testing and verification
- I. High-pressure testing and verification
- II. High current testing and verification
- III. Lightning surge test and verification
- IV. Wind tunnel test, withstand 17-level gusts or more
- V. Installation of equipment
-
[2] Application management platform program development
- I. Web design future energy boundary "transmission equipment maintenance management system"
- II. Responsive Web Design (RWD)
-
III. Ground management interface
-
[1] Dynamic thermal rating equipment and small weather stations with wireless communication testing and verification
-
Target
In order to realize the dynamic thermal rating monitoring, this plan will investigate the current application status of dynamic thermal rating or related equipment on the market in order to understand the relevant results of foreign dynamic thermal rating research as a reference for this research. The plan uses domestic existing dynamic thermal rating monitoring equipment, installed on Taipower's designated transmission line, and installs a small weather station to collect real-time weather information around the tower to collect real-time and accurate power line dynamic heat capacity information. Through big data and Application of artificial intelligence technology, analyze and discuss the prediction technology of dynamic heat capacity. At the same time, this plan also intends to build a dynamic heat capacity cloud application management platform to display the power line environment information and dynamic heat capacity information in real time to provide more information for maintenance personnel to judge the safety of power lines.


Optimizing Taipower's Operational Efficiency Through Advanced Data Analytics Infrastructure.
Introduction
Taipower strategically invests in a sophisticated big data platform, emphasizing the optimization of data analysis, with a specific focus on high-frequency Smart Meter Data collected every 15 minutes. This optimization not only enhances operational efficiency but also brings tangible benefits, such as cost savings and faster decision-making. Combining this data with customer attributes, weather patterns, and economic activities requires a robust data warehouse with massively parallel processing (MPP) capabilities, ensuring seamless data collection, storage, computation, and analysis.
Taipower achieved a significant milestone with the successful implementation of the "Meter Data Management System (MDMS)" in 2020, encompassing all Advanced Metering Infrastructure (AMI) customers' data. Additionally, Taipower ‘s Enterprise Data Platform commenced operations on December 1st, 2021.
The Plan of Enterprise-level Platform
-
Origin of the plan
With the continuous advancement of Taipower's operations, driven by the deployment of smart grids, widespread adoption of smart meters, and the flourishing influence of renewable energy sources, the Taipower's business operations is becoming increasingly complex. This requires the establishment of a comprehensive enterprise analytics platform to bridge data silos among business units and establish a forward-looking, data-driven strategy. The primary goals include enhanced grid management, more efficient demand-side operations, improved power quality, heightened operational efficiency, increased customer satisfaction, and an overall enhancement of company profitability and competitiveness.
-
Project goals
The project delineates three specific objectives:
-
[1]Integration of Company-wide Operational Data
Establish an Enterprise analytics platform that seamlessly connects smart grid data, including AMI meters and ERP transactions. This initiative aims to create a smart enterprise integrated structure, enabling real-time insights for faster and more informed decisions.
-
[2]Training Data Scientists and Promoting AI Application
Invest in cultivating top talent by empowering data scientists with professional training platforms, which equips them with a comprehensive skillset, including data extraction, cleaning, enrichment, and model building. This approach fosters unique core skills combined with domain-specific knowledge, positioning the company advantageously in the evolving landscape of data-driven strategies.
-
[3]Implementing Data Transparency and Enhancing Data Activation
This involves constructing an enterprise-level analysis environment built on three key pillars: data source, data storage platform, and data visualization platform. These components work together to streamline data collection, boost storage and computation, enabling effective visual analysis.
-
[1]Integration of Company-wide Operational Data
-
Major Tasks:
The core tasks involve constructing an enterprise-level analysis environment, which includes:
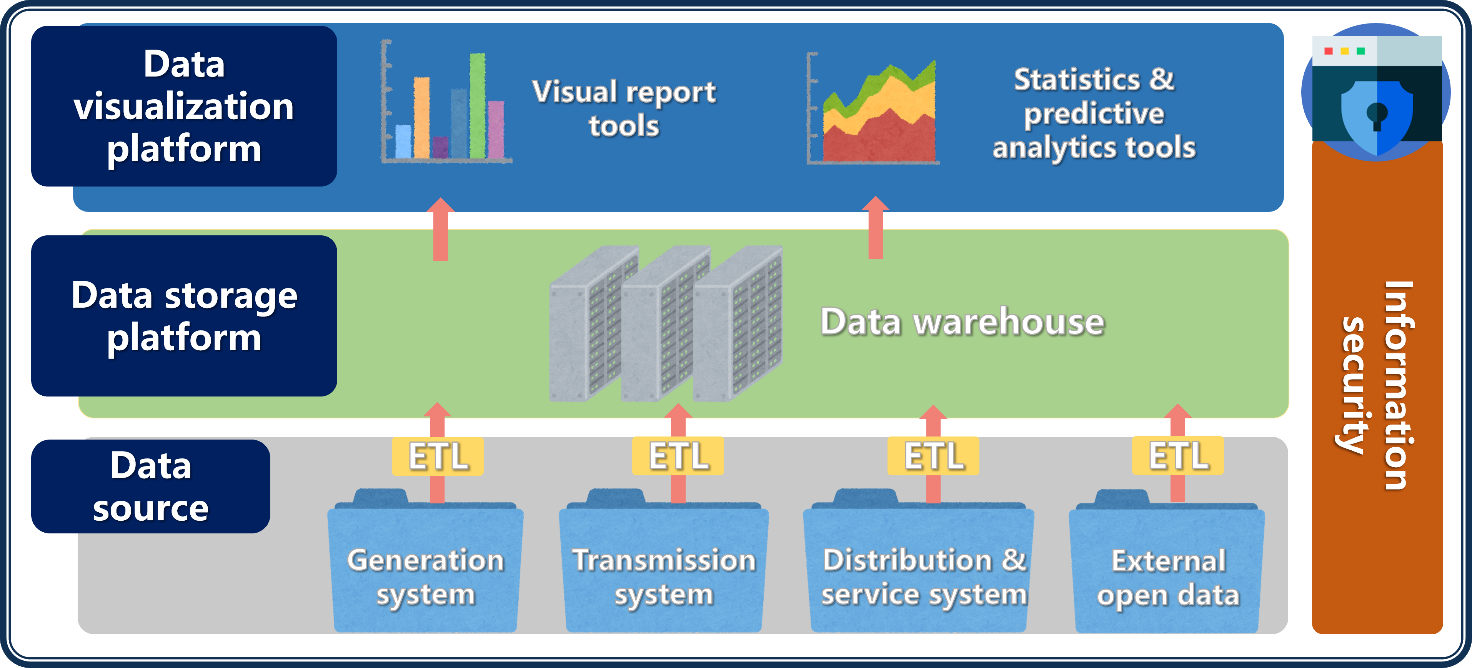
Figure 1 Architecture Diagram- [1]Data source
Focus on collecting and cleaning data from multiple sources, ensuring data integrity through validation, quality assurance, and translation. Employ automatic scheduling mechanisms to manage transmission processes efficiently.
- [2]Data storage platform
Implement a highly scalable platform that provides resources for high-speed computing and flexible data storage using MPP architecture.
- [3]Data visualization platform
Empower users with visual analysis tools for creating interactive reports. These tools enable data-driven decision-making through diverse chart types and robust statistical functions. Additionally, the platform allow users to leverage algorithms and build advanced analytics models for predictions and optimizations.
The implementation of this enterprise-level platform will not only streamline data management but also empower Taipower to make informed decisions, improve operational efficiency, and keep a competitive edge in the evolving energy landscape.
- [1]Data source
Use Cases
-
TPC e-Bill service
-
[1] Service Description
The TPC e-Bill service with simple registration and customer number setting has been provided to TPC users for quick inquiry of power consumption data and easy bill management. It is presented via easy-to-understand electronic interface and micro-animation such that users can have quick access to bill related information to facilitate the self-management of amount power consumption behavior and to achieve the energy saving effect.
The main visualization design of the front page is based on the illustration style with the layouts of four seasons. And there are the renewable energy subjects of wind power, solar energy, and hydraulic power generation to attract users to TPC e-Bill service in order to achieve the goal of paper reduction and environmental protection.

Figure 1 Front page main visual design (Spring)
Figure 2 Front page main visual design (Summer)
Figure 3 Front page main visual design (Fall)
Figure 4 Front page main visual design (Winter) -
[2] Function Description
-
a. General User
“General User” can have access to the website related information including payment status enquiry, bill pre-estimate, website tutorial, FAQ, and news.
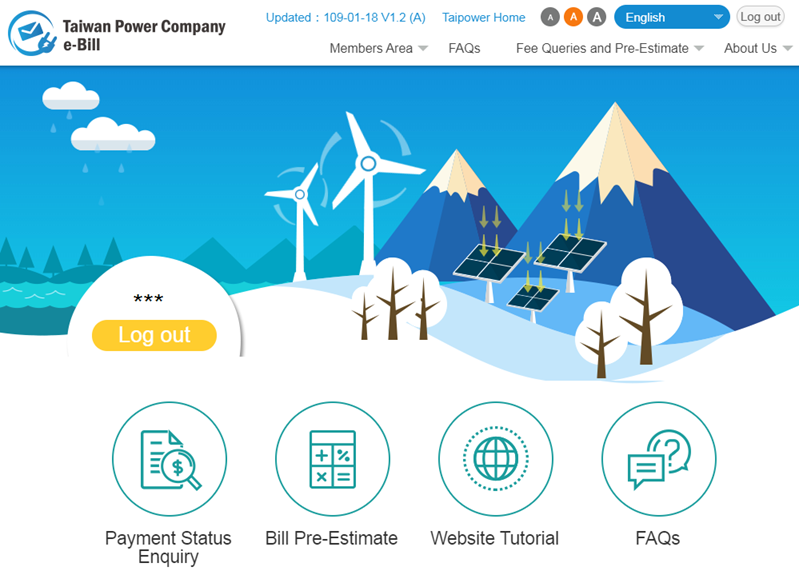
Figure 5 Front page of TPC e-Bill service -
b. Members
Users can register to become the “Member” of TPC e-Bill service. In addition to periodic bill notification and payment certificate in the form of email, users can also have access to historical bill data. A member could login the TPC e-Bill service to have access to the functions of basic information management, bill inquiry, and analysis of amount consumption chart. To make the operation easily, the bill information of all registered customer numbers will be listed on the login screen, and the provided functions are the latest monthly bill, total amount, payment status, the payment barcode to be downloaded (the unpaid bill can be directly downloaded), re-sending of electronic notification, and historical data.
-
a. General User
-
[3] AMI Real-Time Inquiry
To facilitate the real-time inquiry of amount consumption data by AMI smart meter users and thus promoting the power consumption management, the “AMI Area” icon behind the customer number of AMI could be selected to enter the AMI dashboard function, which provides various functions such as comparison of various real-time amount consumption data, self-defined upper limit of amount consumption, analysis of amount consumption statistical chart, and rate service evaluation.
Note: Users could enquire real-time amount consumption data of the previous day by noon.
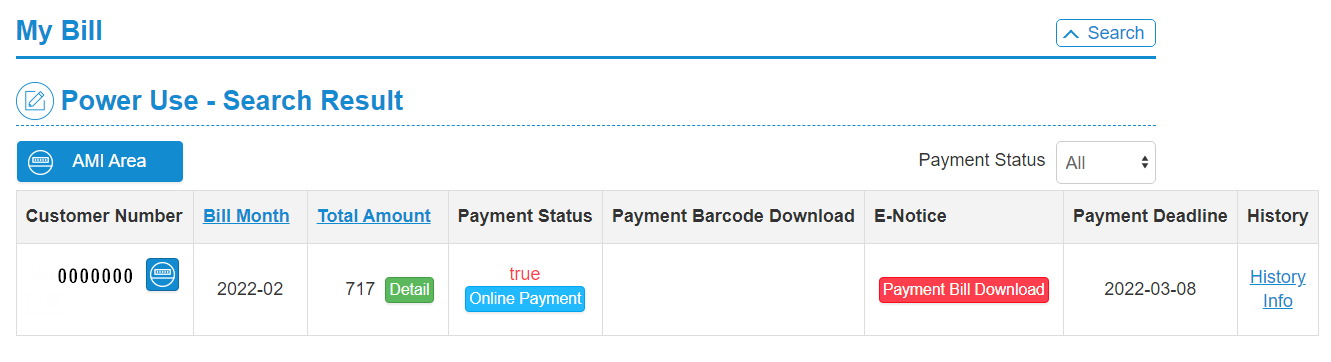
Figure 6 My Bill-
a. The percentage comparison of total AMI amount consumption and total amount trend
The percentage comparison of total AMI amount consumption of current year and last year will be shown on the indicator dashboard. The monthly power consumption trend for the two years next to the dashboard to directly compare whether the total consumption has increased or decreased.
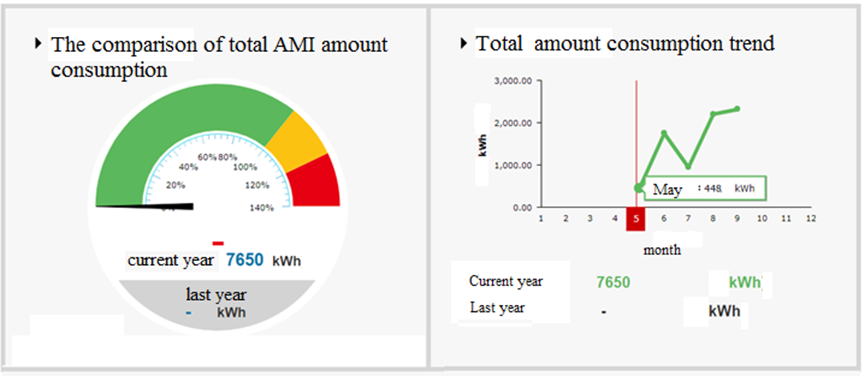
Figure 7 The percentage comparison of total AMI amount consumption and total amount trend -
b. Comparison of average total consumption in the same area/industry
The users could check their own total consumption and the average power consumption in the same area or industry. And it would provide different contents via different scenarios to guide users to change their energy consumption behaviors.
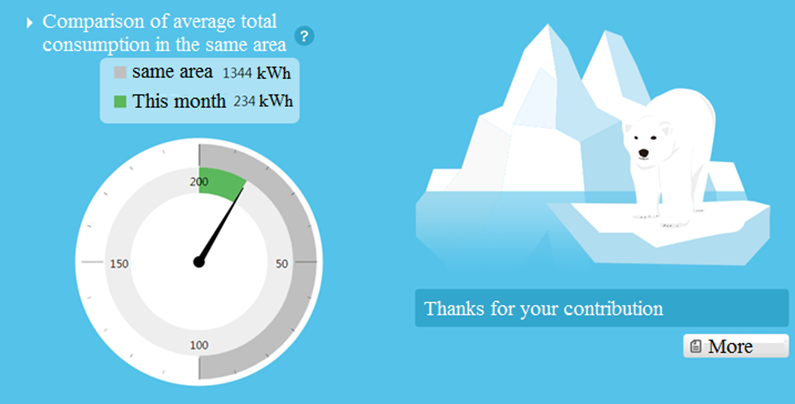
Figure 8 Comparison of average total consumption in the same area/industry -
c. Setting Daily Power Limit
Provide users with the ability to set the upper limit of daily electricity consumption. When the electricity consumption exceeds the self-set degree, the user will be notified by email.

Figure 9 Self-defined amount consumption upper limit and abnormality notification -
d. Carbon Emission
According to whether the amount consumption exceeds the " average total consumption in the same area " or " Self-defined amount consumption upper limit ", the icons of carbon emission and trees are provided to strengthen the connection between amount consumption and energy saving.
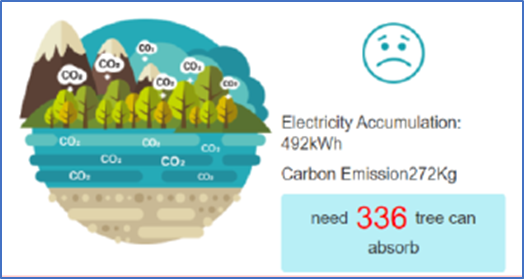
Figure 10 Carbon Emission -
e. Monthly Consumption
The total amount consumptions of all months are presented and compared in the form of monthly pie chart, and different colors (green, yellow, red) are used to show whether or not it is increased as compared to the base month.
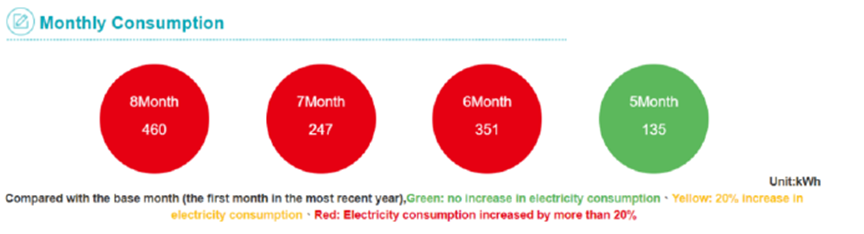
Figure 11 Monthly Consumption -
f. AMI Statistics
The real-time and detailed AMI amount consumption charts are presented in graphics to shown the statistics based on “year”, “month, “day”,“15 minutes”,and the daily (24 hours) comparison.
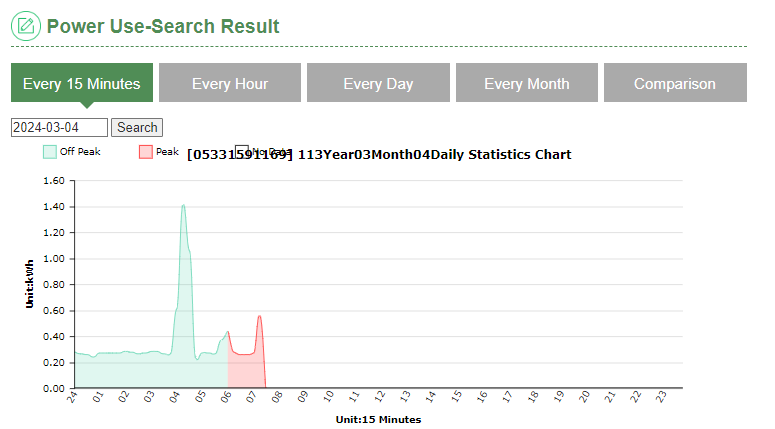
Figure 12 AMI real-time statistical chart -
g. Rate Suggestion Pre-estimate
The trial calculation comparison amount of simple rate plan is provided according to the past AMI real-time amount consumption information of users to help users assess which rate plans are more appropriate according to their energy consumption habits.
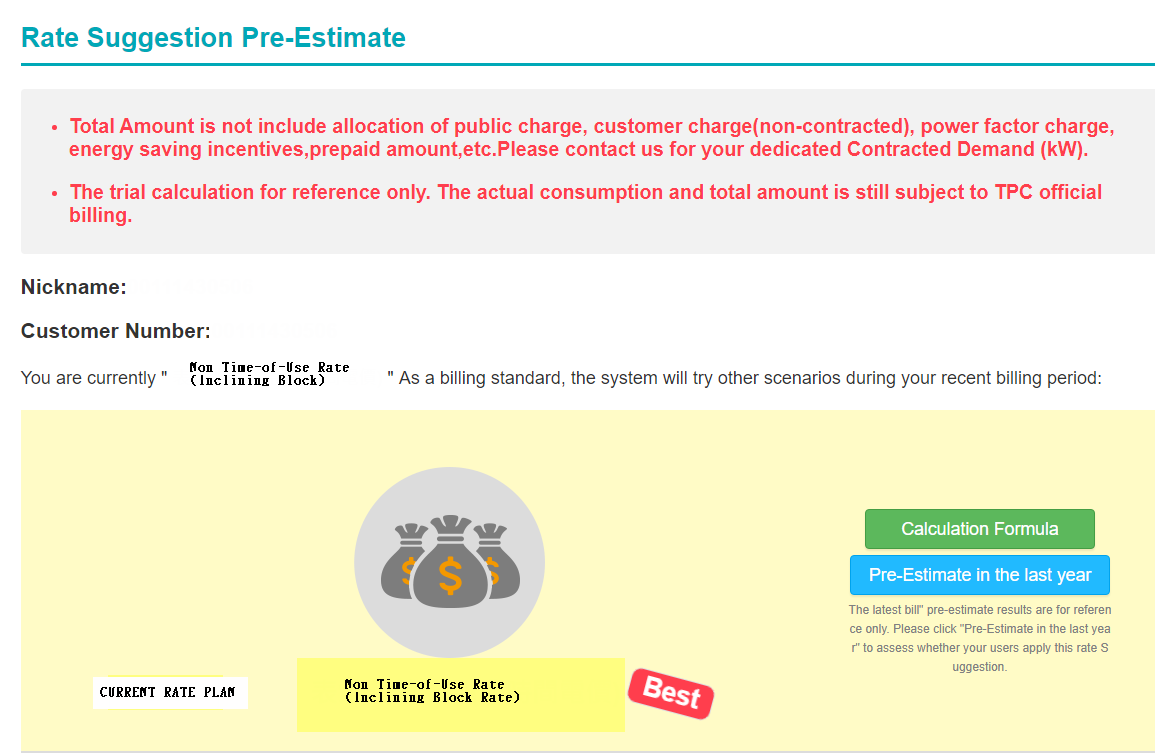
Figure 13 Rate Suggestion Pre-estimate -
h. Unbilled Electricity Bill Amount Estimate
According to the past AMI real-time amount consumption information of users, we provide the estimate of the unbilled power consumption and the bill amount to help users control electricity usage.
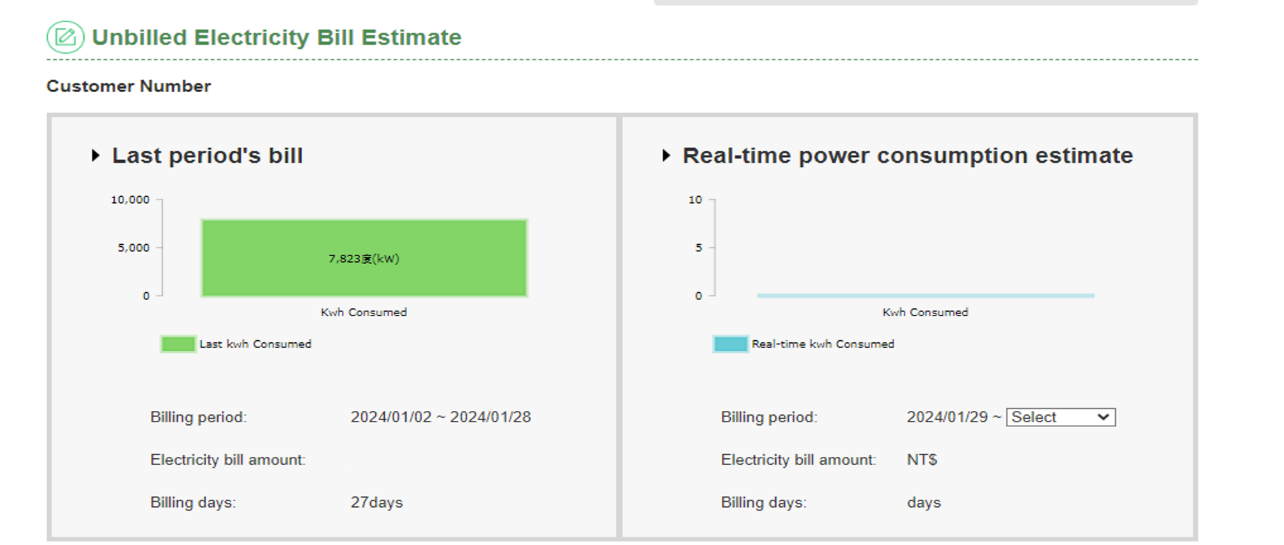
Figure 14 Unbilled Electricity Bill Estimate -
i. Amount consumption analysis chart
Users are provided with the power consumption charts of recent 48 hours for comparative analysis with the same timeframe of last week and last month.
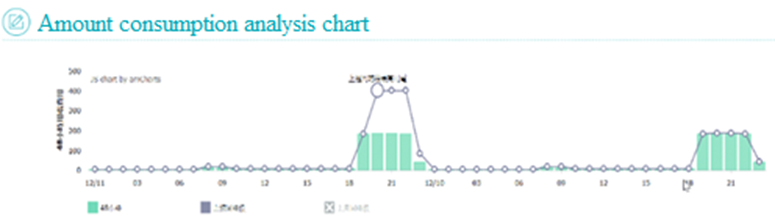
Figure 15 Amount consumption analysis chart -
j. Maximum Demand Alert
If the Maximum Demand(kw) exceeds 95% of the Contracted Capacity(kw), the user will receive reminder email, which remind user to avoid Customer Charge(Non-Contracted) fee.
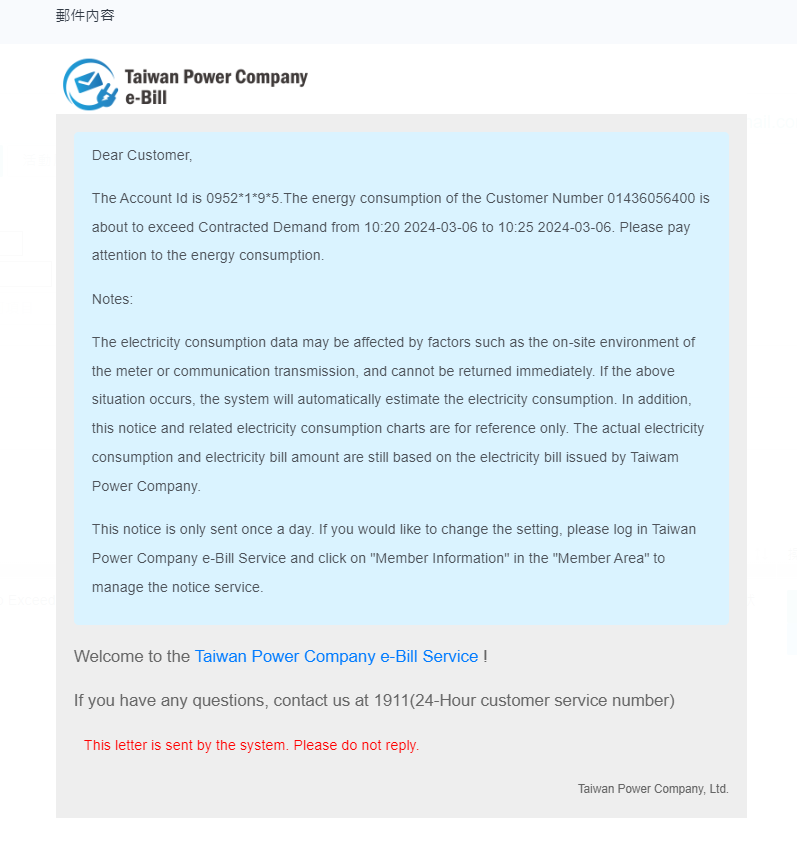
Figure 16 Contents of notification letter
-
a. The percentage comparison of total AMI amount consumption and total amount trend
-
[4] Future planning
-
A. Enhancement of interactive design
We will continue enhancing the interactive service for users and simplify operation interface and enhance the friendliness of website by user friendly and dynamic guidance approach in order to enhance users’ willingness of registration and use while achieving the energy saving efficiency of all people.
-
B. Add new application functions
A new method is added to estimate the number of days of use based on the amount of electricity bill, allowing users who need to prepay electricity bills to estimate the number of days that the prepaid amount can be used, and then determine the prepayment amount according to needs.
-
C. Continue to integrate member accounts with Taiwan Power APP
Allow users to use services on various platforms of TPC through a single set of account passwords.
-
A. Enhancement of interactive design
-
[1] Service Description
-
Future planning- Taipower APP
-
[1] Electricity information and comparison:
Provide users to select different time intervals to view the electricity consumption overview, such as every 15 minutes, hours, days, months, or choose two intervals for self-consumption comparison, or with comparing the average electricity consumption of users in the same area. Self-management of electricity consumption.(as shown in Figure 17)
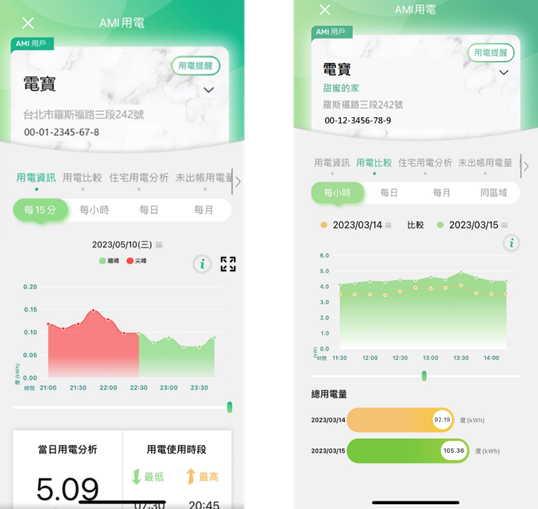
Figure 17 Electricity information and comparison -
[2] Residential electricity analysis:
By utilizing power usage data and survey responses from users, we provide an analysis and estimation of home appliance usage patterns. To access this service, first-time users must click "Subscribe Now" and complete the electricity analysis questionnaire. The analysis results will be available the next day. By accessing “Residential Electricity Usage Analysis,” you will be able to view the estimated electricity consumption of six common household appliances over the past two weeks (as shown in Figure 18)
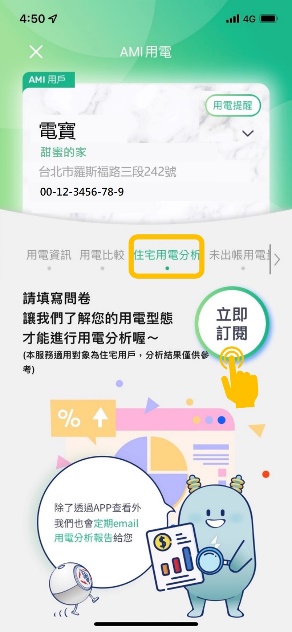
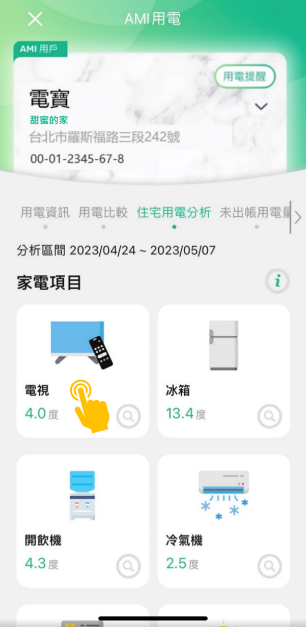
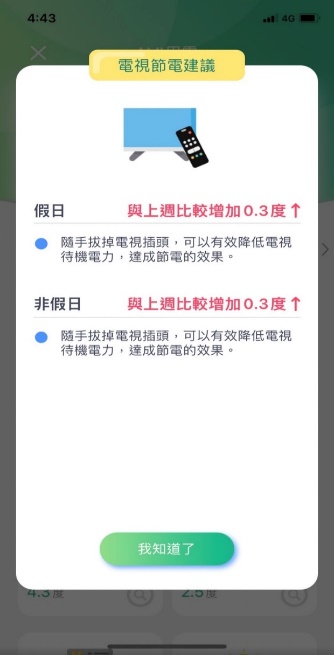
Figure18 Residential electricity analysis -
[3] Unbilled Electricity Consumption:
The system estimates the electricity charges based on the unbilled electricity consumption from the last meter reading up to yesterday, and also provides the amount for the same period last year for comparison(as shown in Figure 19).
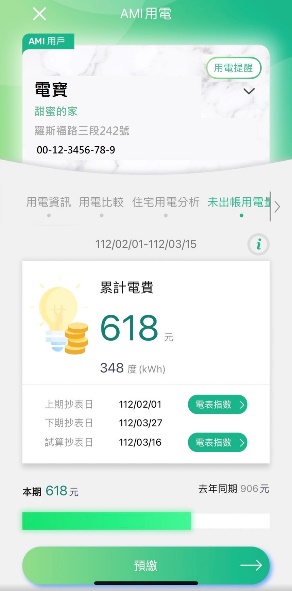
Figure 19 Unbilled Electricity Consumption -
[4] Rate trial calculation:
Based on the latest and the past year's electricity billing information, evaluate the user's power consumption habits and recommend the most optimal electricity rate plan.(as shown in Figure 20)
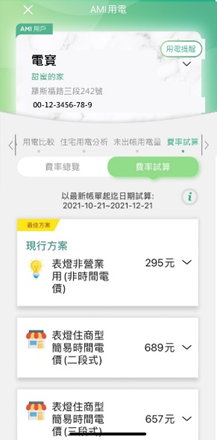
Figure 20 Rate trial calculation -
[5] Electricity consumption reminder(Only the account holder can use):
A daily limit or budget for electricity consumption can be set, and the system will schedule a review of the previous day's usage or calculate the electricity bill. When the set limit is exceeded, a push notification will be sent to the person who set the limit.(as shown in Figure 21)
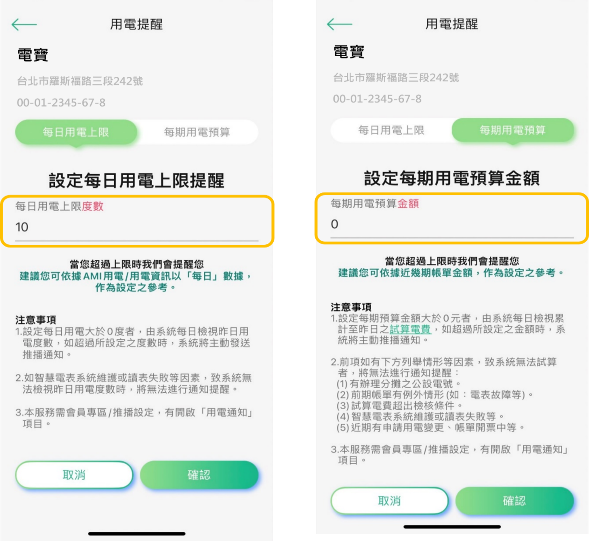
Figure21 Electricity consumption reminder -
[6] The prepayment:
Enter the prepayment amount. If there are any outstanding electricity charges, they must be paid together (as shown in Figure 22).
-
a. General users: Display the amount that has been calculated (this amount has not been billed in the New Billing System) User can enter any amount and pay it off.
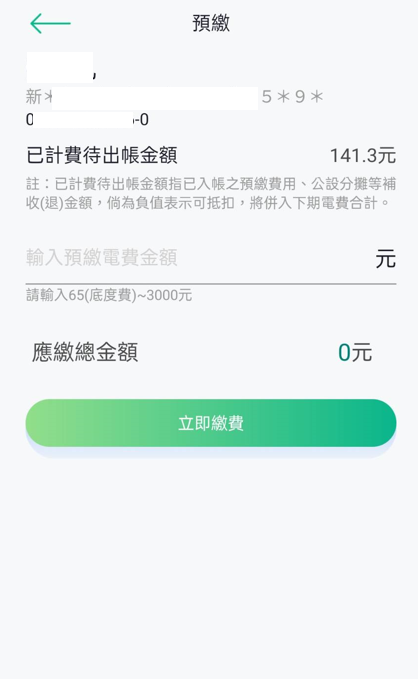
Figure 22 General users(prepayment)
-
-
[7] Relocation settlement:
In addition to self-meter reading、taking photos of meter and making an appointment for Taipower personnel to read the meter for settling bill. If the system verifies that the user has a AMI meter, it will automatically read the meter index based on the settlement date entered by the user to perform an estimated bill calculation. If the meter reading fails, the process will follow that of non-AMI users, allowing the user to select a meter reading method (as shown in Figure 23).
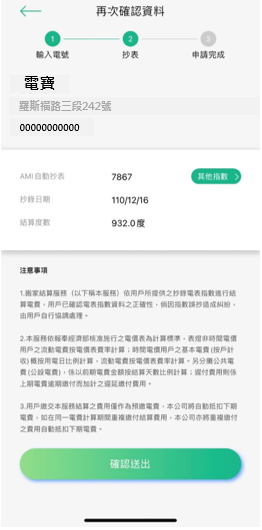
Figure 23 Relocation settlement -
[8] Electricity Usage Routine Index:
By establishing a usage model based on AMI (Advanced Metering Infrastructure) data, this feature evaluates your daily electricity patterns to determine if they align with your usual routine. The analysis is updated daily at 23:00, providing the seven most recent results for your reference. Please note that due to the time required for data acquisition and processing, this service does not provide emergency or safety notifications (as shown in Figure 24).
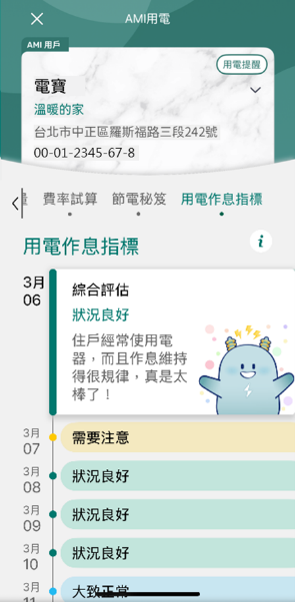
Figure 24 Electricity Usage Routine Index
-
[1] Electricity information and comparison:
-
Explore potential target customers through AMI data analysis
Leveraging AMI data analytics, we have identified potential participants for the Demand Response Program. By constructing predictive models based on historical electricity consumption patterns, we have precisely targeted high-potential users, thereby significantly enhancing program participation and effectiveness. In 2025, 996 target users were selected for the Demand Response Program. On the night peak load day of July 3, 2025, these users achieved a demand reduction of 1,140 MW, representing 97% of the total demand reduction across all participating users (1,170 MW). This contribution bolstered the system's operating reserve by approximately 4%.
Hosting Capacity Visualization System for Transmission Power Supply System and Power Distribution System
-
Background Information
In recent years, with the government expanding its efforts to promote the green energy development policy, related renewable energies such as photovoltaics, wind power, hydroelectricity and geothermal power, all of which are Distributed Energy Resources (DER), will be massively grid-connected to the distribution system, and it will significantly change the entire distribution network structure. The electric power will no longer be generated by the generator units in large power plants, but rather be generated by small and decentralized devices. In order to fully understand the grid-connection status of the renewable energies, Taipower began to develop the Distribution Planning Information System (DPIS) since years ago, attempting to regulate the possible impact to the system when those energies are grid-connected by adopting the application review mechanism for Distributed Energy Resources.
According to records, there are nearly 10,000 feeders in the power distribution lines in Taiwan. The amount of data is huge and its number in the hosting capacity sections is as high as 3.26 million. When presented on a traditional web-based graphics platform, it would consume a considerable amount of software and hardware resources and may result in performance problems caused by a large amount of map data loading. Therefore, the Map Tile display technology will be used to generate the map tile files after the incorporation of timed calculations of each hosting capacity section, and then combined with the TGOS Address Geocoding Service and the generic version of the electronic maps to construct the visualized distribution feeder hosting capacity system. The system provides the public or the industry to conduct a location query by means of an address to achieve the purpose of visualizing the distribution feeder hosting capacity.
-
System Architecture Description
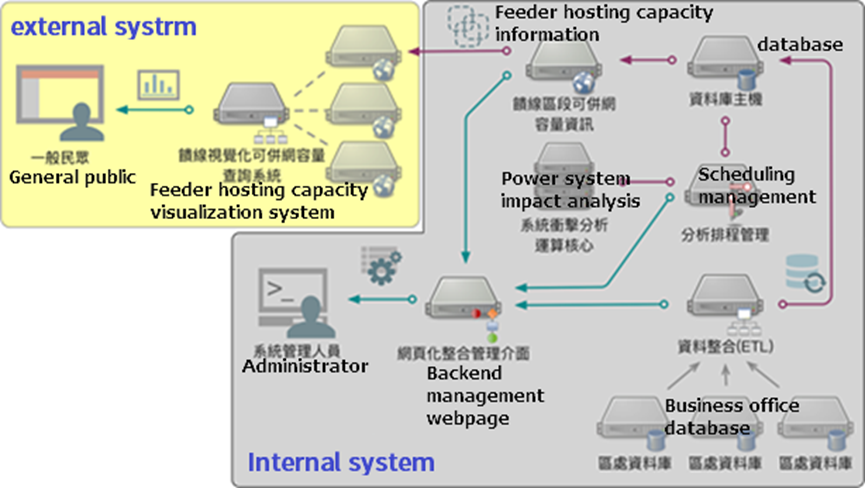
The system is divided into two parts: the internal system and the external system. In order to allow external users to have a more intuitive understanding on the possible hosting capacity of feeder line, this project will regularly extract the topology information of existing distribution equipment from each business branch of Taipower by using the Extract-Transform-Load (ETL) technology. This project then simplifies it to become the information structure required to calculate the possible hosting capacity and subsequently summarize and send it to the information center as the basic information for computation. We tested several computing cores and compared their benefits. Analyze its accuracy and calculation speed, and choose the best one.
Calculation results will integrate to the Geographic Information System (GIS) technology and displaying the possible hosting capacity of each feed line section on the map with colors. Furthermore, to solve the performance issue that may be caused by external users downloading a large number of map data, this project constructs a feeder hosting capacity visualization system by using Map Tile display technology. It was thereby achieving the establishing hosting capacity visualization of the feeder.
-
Power System Impact Analysis
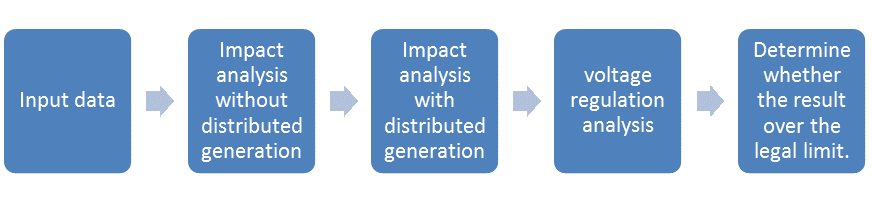
This system integrates data from several systems automatically, such as Distribution Mapping Management System, Renewable Energy Management Systems, Distribution Planning Information Systems, etc. Input data mainly include wire parameters, transformer parameters, electrical connectivity, power distribution equipment data, transformer data, load data, renewable energy data, user data, coordinate points, etc. Comprehensively organize all the materials and build a complete feeder input file. The schematic diagram of power system impact analysis is shown in the right picture.
Taipower has about 10,000 total feeders, and the number of calculations for each joint is very large. Considering the overall load of the mainframe and the accuracy of the data, the core of the most cost-saving calculation is adopted. Each joint will be inversely calculated one by one, and get the maximum hosting capacity finally. It will be the basis of updating the externally displayable hosting capacity.
-
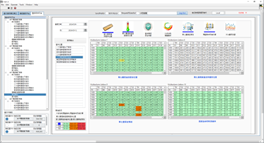
System introduction
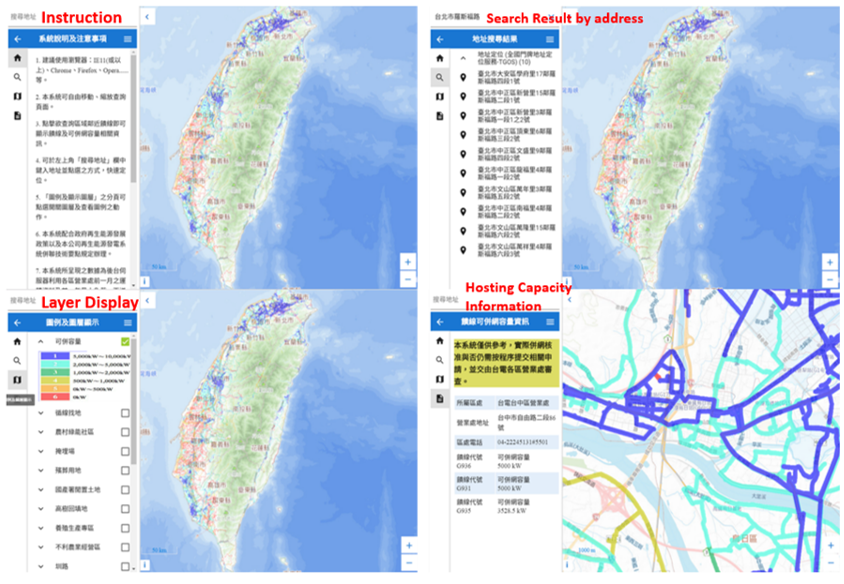
In order to allow the user to clearly view the hosting capacity of each section of feeder, we indicate the hosting capacity of each section by means of color display. This referred to the webpages which are built by the foreign electricity utility.
The hosting capacity is divided into six levels and six colors from small to large, and display on the geographic map.
Feeder hosting capacity visualization system for power distribution system:
-
Future Development
The system is designed to collect data, calculate hosting capacity and release map tiles automatically. Through the artificial elimination of abnormalities, it is expected to improve the system's capabilities.
Compared with the relevant open systems of advanced countries, this system is more advanced, integrated and flexible in development. It can provide consistency comprehensive information for the government, the electricity industry, the industry, and users about renewable energy build land and hosting capacity. It may help to achieve 20% renewable energy government policy before 2025.
In the future, more information will be collected to strengthen the system impact analysis and reduce the need for human intervention. We will continue to study and modify the logic of constructing feeder and make the feeder closer to the actual situation.
Renewable Energy Monitoring
-
Introduction
TaiPower company had 174 onshore wind turbines in 18 sites and 21 offshore turbines in 1 site in Taiwan, including 6 brands and 9 models. Each brand of manufacturer has developed and designed its monitoring system. To facilitate the unified and centralized management of real-time operation information of wind power stations scattered across Taiwan and outlying island, a complete integrated monitoring platform system has been established since 2011. After the compiled program interface determines the status of various types of wind turbines, it will organize the operation status in real-time and display on the website.
-
Architecture of the Monitoring platform system
Due to the difference in the communication system of wind turbines, we need to integrate different wind turbine operation information. We set up a system provided with an interface computer beside the original monitoring computer of each wind power plant, connect with the OPC communication protocol to retrieve the real-time operation information. The data is transmitting from the regeneration office via of Taipower company through the communications network to monitoring center server room in office (PISRV1,main server)and Onshore Wind Power Plant computer server room (PISRV2,backup). Then the original data of PISRV1 will transmit to another server (PISRV3) on the company intranet through an isolator, finally established the data structure through a logical layer computer (PIAF01). The web host (PIWEB) then retrieves the data and builds a website for users to connect with the browser to improve network.
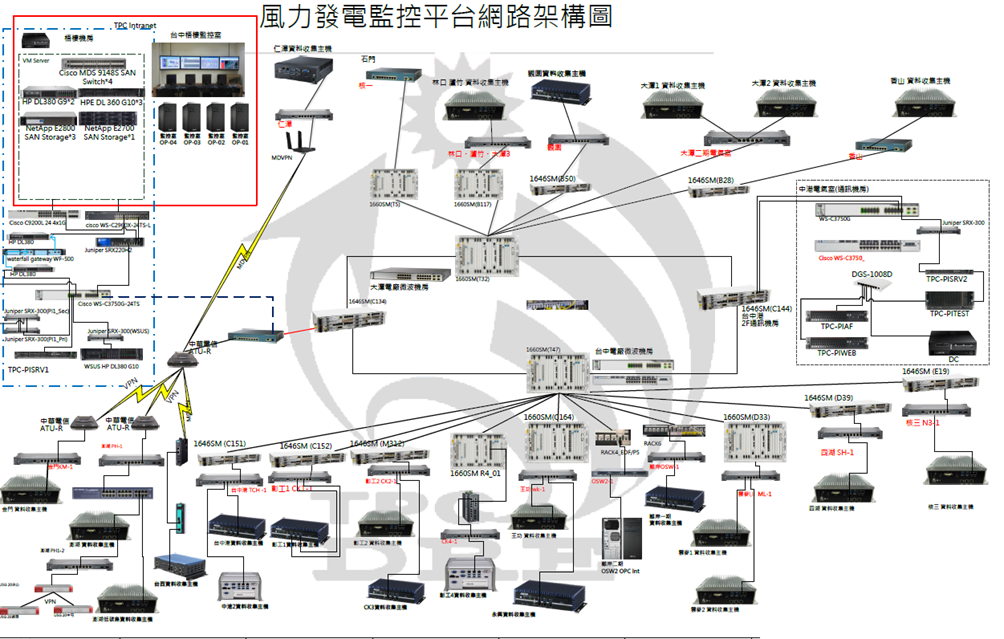
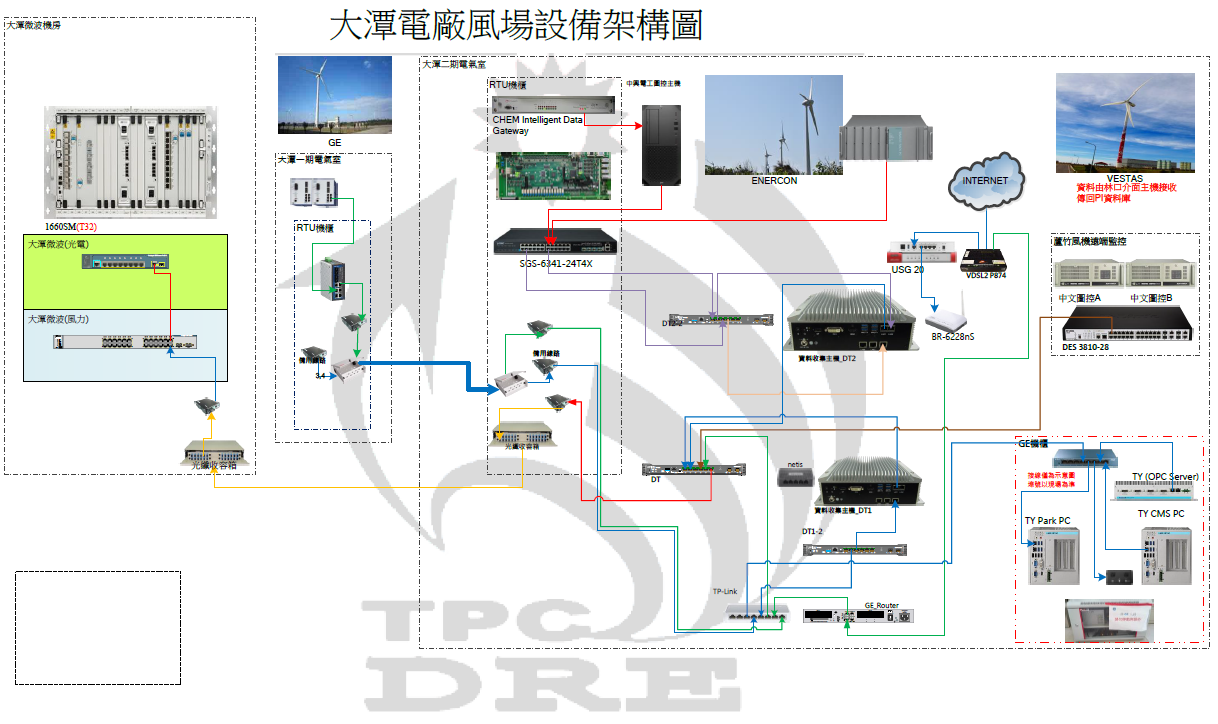
Each wind power station system is roughly similar. Taking the〝Datan wind power station〞as an example, it was established in three-phase with a total of 7 wind turbines, 3 different brands of the manufacturer, including 2 GE’s、2 Enercon’s and 3 Vestas’s wind turbines. Therefore, it is more complicated to retrieve data in the interface. The data transmission structure is as shown below.
The wind turbine operation data of Datan wind power station was retrieved from the original computer SCADA data and directly transmit to the main engineering room in Taichung control center office through the interface of Datan power plant microwave computer room.
-
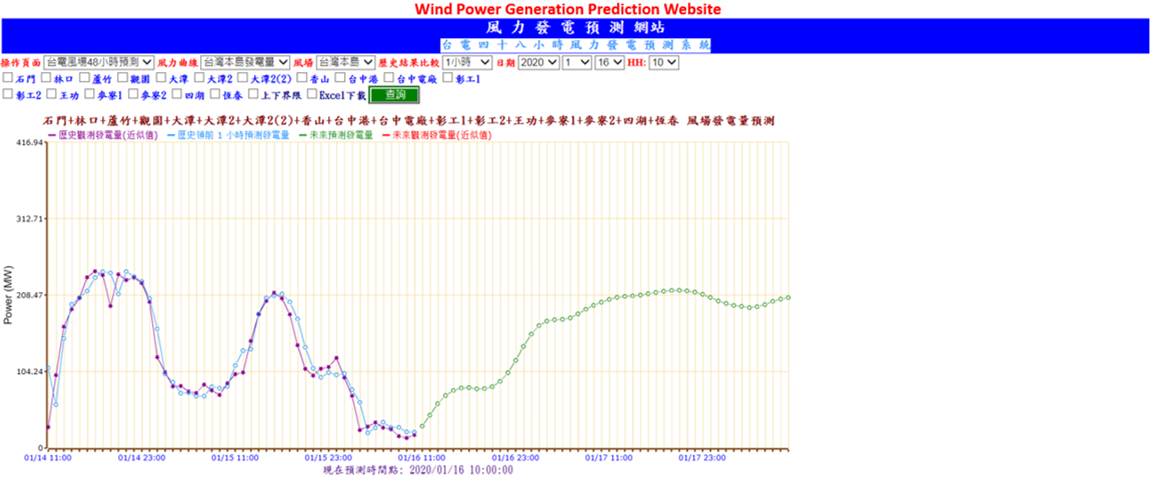
Security and Convenience
In response to the intermittent renewable energy power generation, Taipower currently collects information on renewable energy power generation systems and developed a 48-hour renewable energy power generation forecasting system through algorithms. It can help to optimize the dispatch and be used to arrange the unit's scheduled maintenance as a massive amount of renewable energy feed-in the grid in the future.