-
✩Introduction
Smart grid is the integrated power network with intelligent power generation, power transmission, power distribution, and users established via information, communication, and automation technologies. It put emphasis on automation, security, and close coordination between user end and supply end in order to enhance power system operation efficiency, power supply quality, and grid reliability.
Taipower’s policy of promoting “Smart Grid” is based on the “Smart Grid Master Plan” approved by the Executive Yuan on September 3rd, 2012. This plan consists of four major aspects of power generation and dispatch, power transmission, power distribution, and user. “Smart Meter” is associated with the Advanced Metering Infrastructure (AMI) project developed under the “User Aspect”. It is mainly composed of smart meter, communication module (including communication network), and meter information management system. In addition to recording user power consumption situation, and periodic feedback of meter data, it can also replace the manual meter reading.
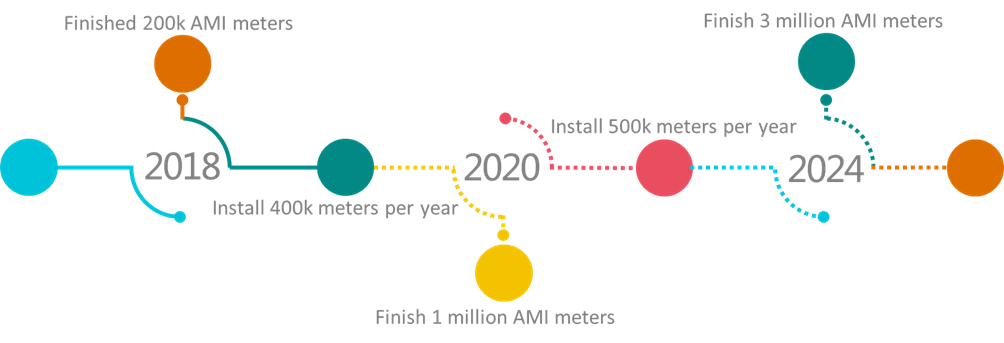
Taipower has completed the deployment of AMI for nationwide high voltage (and above) users (about 24,000 households) in 2013 to be aware of 60% of power consumption in the entire country, and the demonstrative preliminary installation of 10,000 households of low voltage AMI has been completed in 2015 in order to identify various problems as early as possible and to come up with solutions. During the installation period, the complicated building environment in our country and the factors of communication technology and laws and regulations resulted in poor communication (for example, if the building density is high or if the meter is located in the basement or wireless communication dead corner, only the public frequency band of 2.4GHz is available. The transmission distance is rather short, and it is vulnerable to existing communication and environmental impacts. Thus, we could not adopt specific communication technology for deployment just like other foreign countries) and compromised deployment effectiveness. Therefore, we conducted several reviews with Bureau of Energy, MOEA during 2015~2016 and dedicated to take the steady approach of promotion in phases based on the principle of completely solving the communication obstacle during actual practice. And the “Modified Plan for Subsequent Promotion of Low Voltage AMI” was reported to the Bureau on July 28, 2016. According to the “Low Voltage Smart Meter (AMI) Promotional Plan” approved by the 3515th Council of the Executive Yuan for future reference on September 22, 2016 and the amendment of “Smart Grid Master Plan” approved on February 18, 2017, Taipower will set the power saving potential users as the deployment targets, and the deployment low voltage AMI Smart Meter of 200,000 households must be completed in 2018, the accumulated deployment of 1 million households will be completed by 2020, and the accumulated deployment of 3 million households will be completed in 2024, and the accumulated deployment of 6 million households will be completed in 2030.
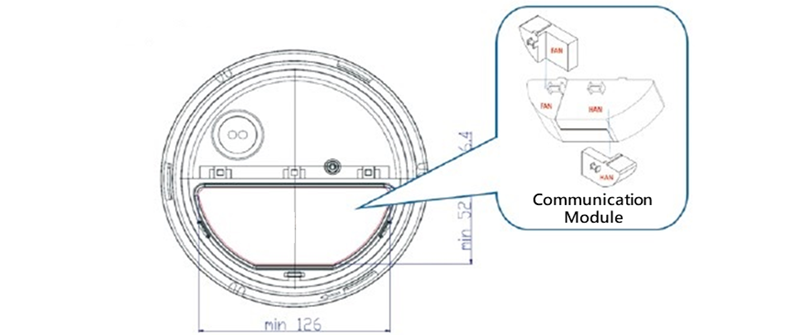
In order to successfully promote the installation of low voltage AMI smart meter, Taipower conducted the research on “AMI Communication Module Evaluation Mechanism and Applicable Technologies” and upgrade the communication module of AMI meter to the pluggable design in order to prevent communication module from being tested and sealed within the meter, thus causing the difficulty in future replacement of communication module (the entire meter must be replaced, thus leading to impact on user power consumption and the increased cost). As a result, the meter maker can be more focused on the R&D of meter technology. In response to our government’s cultivation of domestic AMI communication industry, the expectation is to bring more communication service providers to help with AMI deployment. However, Taipower takes into consideration the rapid advancement of AMI communication technology. In addition to ensuring that it will not be limited by any single communication technology provided by communication service provider, the different communication technologies deployed in subsequent stages of low voltage AMI must be compatible with meters of different brands. Therefore, Taipower will first identify the AMI communication technology suitable for our country, and the large-scale deployment will be conducted based on the obtained results.
In summary, in order to overcome the issue of poor communication in our country due to the factors of complicated building environment, communication technology, and laws and regulations, Taipower has conducted the low voltage AMI smart meter deployment via the separate tendering of meter, communication, and meter data management system. The communication module of meter is upgraded to the pluggable design. In addition to bringing in more meter and communication service providers to help with AMI deployment, it can also take care of the communication upgrade and successful interfacing of meter data management system. Therefore, Taipower has conducted the low voltage AMI smart meter communication evaluation mechanism, and the communication technology tests have been conducted via meter installation at the site or in the laboratory to select qualified communication service providers to help with AMI deployment in our country. In addition, Taipower has also actively requested the 839~851MHz public industry communication exclusive channel with better penetration from our government. In July 2018 our government officially approved the use 839~847MHz public industry communication infrastructure exclusive channel with better penetration, which would contribute to Taipower’s large scale deployment of low voltage AMI in the future.
-
✩System Architecture
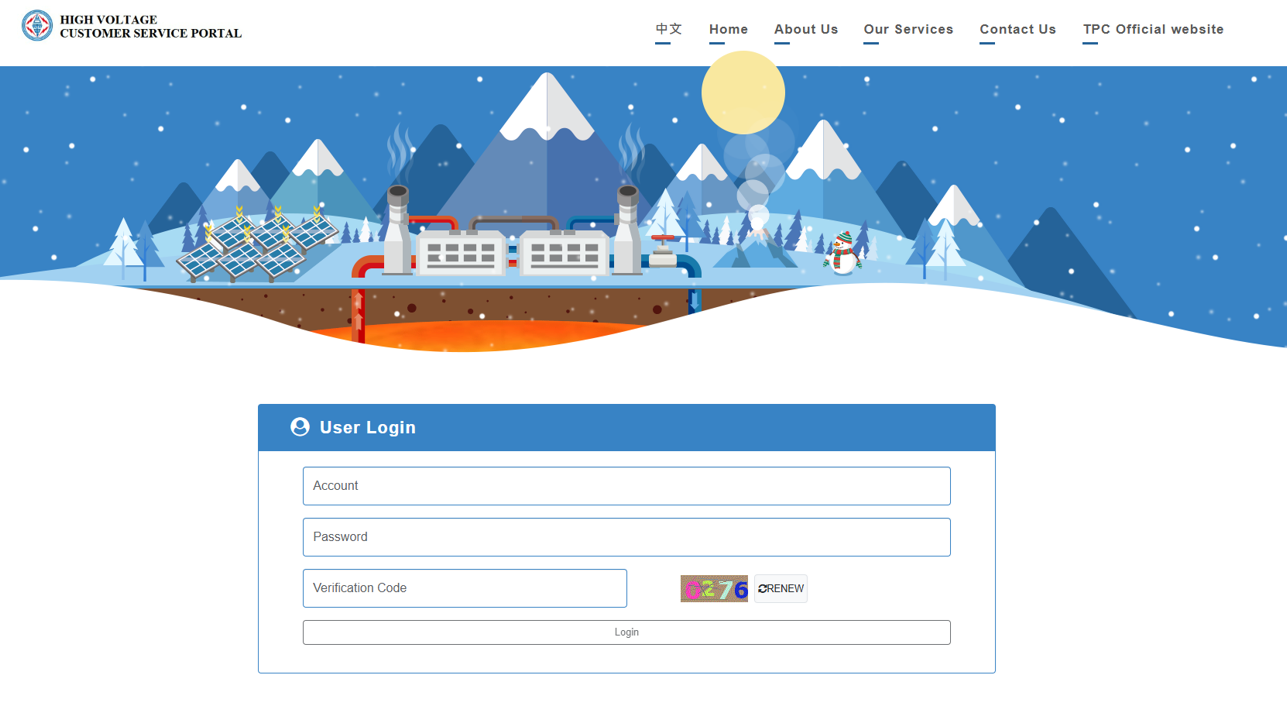
Taipower learned a lot from the experience of the AMI deployment of low-voltage customers pilot program (about 10,000 customers) and try to apply more modularized, standardized method for now (two hundred thousand to three million customers) and future deployment. The aim is to wisely deploy, well maintain and support more innovative applications. The system structure of AMI is shown as Figure 1, including smart meter, communication system and meter data management system (MDMS).
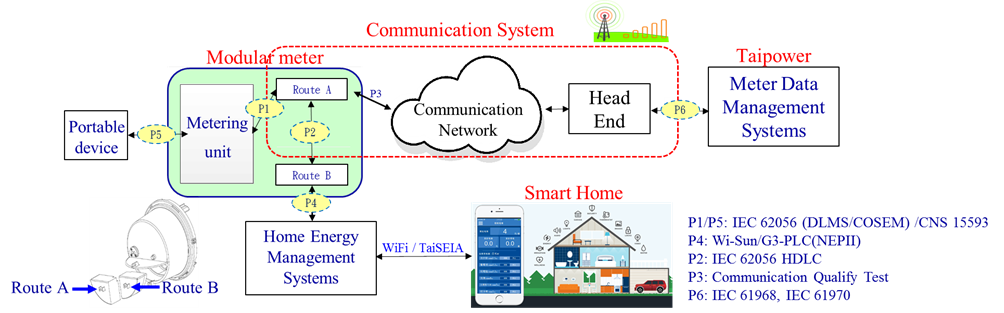
The buildings in Taiwan are mostly apartments. In order to cope with the bottle neck of communication, the innovative pluggable dual-communication module has been launched. Route A can access the data or events from metering unit through P1 interface and communicate with head-end server through P3 interface (wide-area communication network). Each head-ends will send information to MDMS in Taipower through P6 interface. Two types of communication module (wireless Wi-SUN and wired PLC) have been applied to deal with different on-site situations. The modules are optional according to the communication quality test of concentrator.
On the other hand, Route B has been kept for offering an on-demand channel for customer to access meter data directly, which can open the probability of HEMS (Home Energy Management System) application. Wireless or wired type of communication module is also optional due to customers’ switchboard. Smart meter in AMI is not only a point of common coupling between customers and utilities, but also brings in new data applications through Route B (P2/P4).
Considering maintaining and applications, IEC62056 series has been used as the protocol for communication application layer. The meter also support firmware update mechanism, can be interoperable with the pluggable dual-communication module.
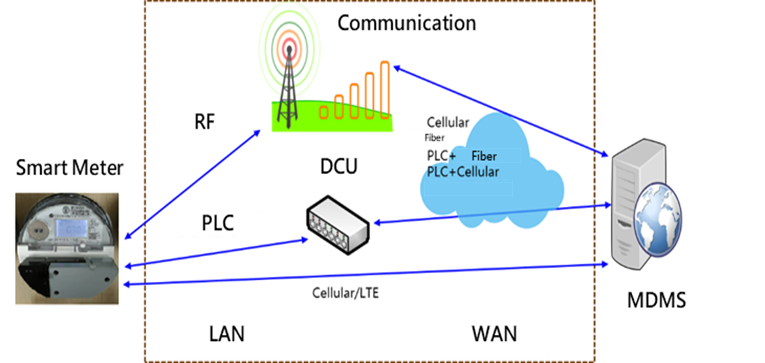
The smart meter system architecture planning must ensure data security, reliability, and privacy. It can be divided into four parts of user, meter, communication network, and meter data management center. With the communication backbone, the meter data can be sent back to the utility or serve as users’ reference via ICT for relevant applications. Our company completed the installation of high voltage AMI smart meter in 2013. Now we are in the process of installation of low voltage AMI smart meter, so the evolution of low voltage AMI smart meter will be described here.
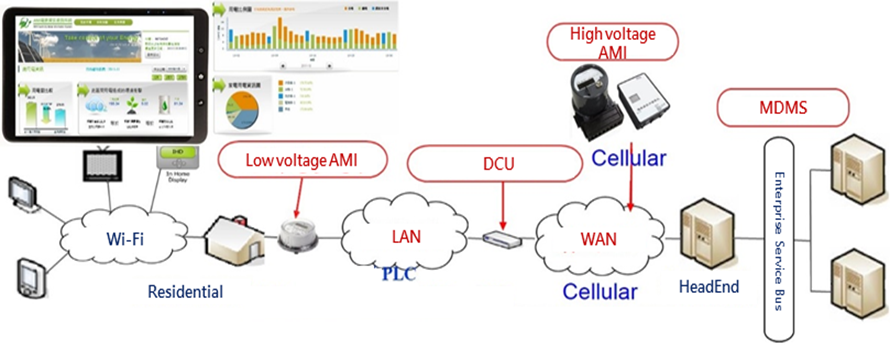
Low voltage AMI smart meter communication network can be divided into the two parts of LAN (Local Area Network) and WAN (Wide Area Network). The adopted communication technology is as described below:
-
■LAN:
Different technologies, such as wired or wireless communication, are adopted in response to different environments (such as collective residential building and distributed housing community).
-
■WAN:
The area with higher construction benefit will have the priority of construction and the consideration of incorporating our company’s feeder automatic fiber optic plan.
The promotion of greater scale must take into consideration of the construction schedule of incorporating our company’s feeder automation or renting the network of telecommunication operator in order to seek the plan of lower cost.
Renting the existing mobile communication network to serve as the data upload path can achieve the advantages of quick deployment and low installation cost, yet there is a constant communication fee for the future operation. In addition, there are the issues of coverage rate and communication dead corners of wireless communication, so the communication quality measurement must be conducted before the selection of deployment sites.
According to the plan approved by the Executive Yuan, our company completed the 10 thousand households low voltage AMI installation project in 2012. In this project, the data of multiple meters was read via RF or PLC technology by using concentrator or receiver (AP), and it was sent back to the control center via optic fiber or mobile communication. So, the communication network is the key to its reliable operation. So, this deployment (early stage) could be used to set the deployment speed, the technical capability of installation personnel, and the integrity, stability, and compatibility of the entire system in order to find problems as early as possible and to come up with solutions.
The experience of the installation of this demonstrative project revealed that the actual deployment was limited by the installation location of communication equipment, complexity of onsite environment, the lack of exclusive frequency band, laws and regulations, and local customs. As a result, the communication calibration after deployment took a lot of time, thus resulting in schedule delay and significantly increased operation and maintenance cost. Therefore, the issue of communication technology must be solved before the large-scale low voltage AMI can be effectively deployed in the future.
In order to solve the communication problem of the installation of demonstrative project, our company carried out the research project of “AMI Communication Module Evaluation Mechanism and Applicable Technology” in 2016~2017. Considering the long-term promotion AMI, it can be divided into low voltage AMI meter, communication system, and meter data management system (MDMS). And all interfaces are re-defined. The flexibility of AMI communication selection is to be maintained via “Communication module upgraded to pluggable design” in order to find the communication technology most suitable in the environment of our country.
Based on AMI communication evaluation operation, our company can conduct document review operation, experimental field test, and test and evaluation of communication technology with respect to the communication system manufacturers participating in the evaluation. So that communication system manufacturers can conduct initial test of communication environment, reduce the impact of building density and the number of meter collection, excluding the limiting factor of installation site of concentrator, clarifying the source of PLC communication technology interference, and improve the communication dead corner. In 2017 there were a total of 5 manufacturers which passed the communication system evaluation and participated in the procurement project of communication system of our company, and now increase to 7 manufacturers. They used the communication technologies passing the evaluation test according to the procurement regulation to help our company deploy low voltage AMI smart meter.
MOTC announced on July 16, 2018 that 839~847MHz could be used for smart meter reading system of livelihood public business, and our company was provided with exclusive frequency band for large scale deployment of low voltage AMI smart meter. Considering the rapid development of communication system, our company will continue to conduct AMI communication evaluation operation. For our company, the communication technology qualified by the evaluation can ensure the stable communication of installation of AMI smart meter in response to the development and evolution of communication system.
-
■LAN:
-
✩Deployment Schedule
Taipower has installed AMI meters for large (all extra-high-voltage and high-voltage) customers in 2013. For small (low-voltage) customers, Taipower plans to install up to two hundred thousand, one million, three million, and six million AMI meters in 2018, 2020, 2024, and 2030 respectively. The schedule was approved by Executive Yuan on February 18, 2017.
There are more than 15 million electricity customers supplied by Taipower. Even if finishing 3 million small customers’ AMI deployment in 2024, the penetration of AMI users is only about 21%. However, the power usage of large-scale customers with installed AMI are about 60%, after finishing 3 million customers’ AMI deployment in 2024, Taipower could handle around 81% of power usage information of Taiwan’s power system.In the future, Taipower will be able to install 6 million AMI and handle around 85% of power usage information of Taiwan’s power system in 2030.
Taipower conducted low voltage AMI smart meter deployment via separate tendering of meter, communication, and meter data management system. The current status of deployment is as shown below:
-
■Meter
The procurement of 200,000 units of low voltage AMI smart meters was completed in 2017.The accumulated installation of 230 thousand smart meters was completed in 2018 and 3.4 million smart meters in 2024. Last year Taipower has deployed about 4.1 million smart meters for commercial and residential customers, which occupies about 82.4% of all customers' power usage in Taiwan.
-
■Communication module
The procurement of 200 thousand units of communication modules was completed in July 2018. The installation of 230 thousand communication modules was completed in March 2019. In 2025, we have installed about 4 million communication modules. The total system connection rate between MDMS and smart meter is over 97.6%.
-
■Metering data management system (MDMS)
Metering data management system (MDMS) has been on-line system in 2020, and it can successfully collect and manage 2 million meters data.
-
■Meter
-
✩MDMS Data Interfaces & Service Applications
Along with the schedule of AMI deployment, Taipower is planning to construct a MDMS (meter data management system) which can accommodate with some millions of customers’ AMI data.
MDMS is extremely important in the architecture of AMI. It should be able to offer processed data, which is consistent and can be directly used by other applications, to make sure the applications can be integrated on the same basis. The repetitive data pre-processing work (ETL, Extract-Transform-Load) can also be avoided. MDMS can help earn valuable application by providing good data, related application such as power dispatch, renewable energy, equipment performance, equipment maintenance and power restoration, shown as figure below.
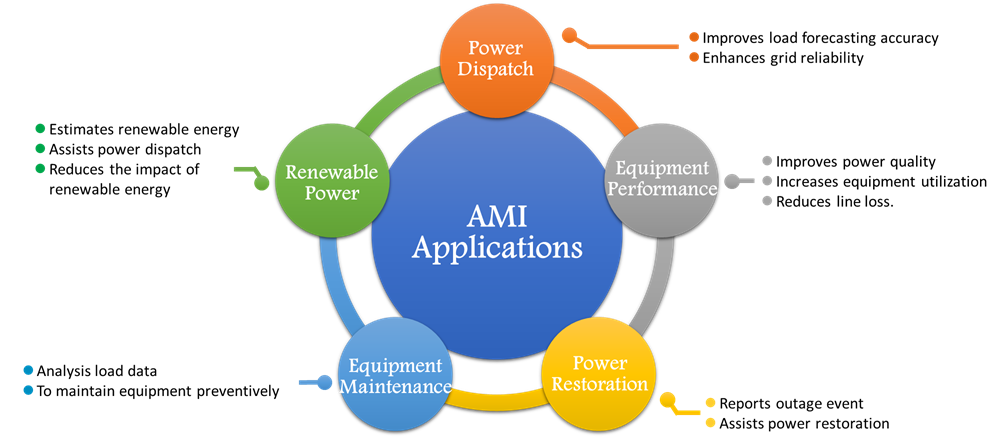
The applications mentioned above are essential subject for different domains to promote their business. For example, billing system, demand response (DR), outage management system (OMS), distribution assets management, etc. In the meanwhile, customers’ AMI information can be provided to ADMS (Advanced Distribution Management System), or system operators for reliable dispatch (with renewable energy) by implementing big-data analytics.
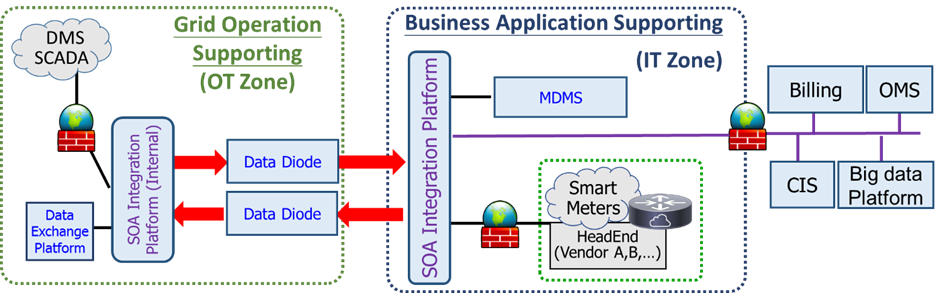
For long-term operation, MDMS adopts SOA (Service Oriented Architecture) as interface standard, which could realize CIM (Common Information Model), to connect IT (Information Technology) and OT (Operation Technology) system, shown as figure below.
MDMS in Taipower is about to complete in 2020, which will lead to various applications on demand/distribution side, that accommodates renewable energy penetration and enable electricity trading for future deregulated market in Taiwan. Big-data applications focusing on meter data will also make great contribution on promoting sensational customer service and innovative business model.
Taipower’s Meter Data Management System (MDMS) is based on the Energy IP products of the industrial leading brand Siemens established on the Vmware Software-Defined Data Center (SDDC) platform. The entire information infrastructure is equipped with high expandability and availability. The short-term target of total amount of AMI deployment is 6 million units. It is expected that MDMS should be able to successfully adapt to and accommodate the aforementioned meters, and it should be able to successfully support the future expansion to 6 million or 14 million units of meters.
To avoid being locked on one single product, the Taipower’s MDMS can be interfaced with Headend equipment produced by different makers in accordance with the IEC 61968-9 CIM standard. As a result, it can greatly reduce AMI deployment cost and the supply risk. In addition, the Enterprise Service Bus (ESB) provided by Green Bird has been incorporated between MDMS and Headend in order to receive the huge amount of AMI data of meter reading and event at the site. The ESB is built on the latest cloud platform technologies such as Kubernetes and Container so that it provides sufficient data buffer, high speed data format conversion, and the highly scalable processing unit capability.
For the purpose of high speed processing of AMI meter event data for real-time support of quick malfunction block identification of Advanced Distribution Management System(ADMS) and reduction of the number of power outage cases accepted based on users’ calls, the Streaming Platform of IBM has been incorporated at the rear end of ESB in coordination with the distributed search technologies (such as Elasticsearch and Kibana) to conduct power outage streaming analysis and to ensure the real-time data processing of meter event. Now customers can see the latest 5 hours ago power consumption data through Taipower’s mobile APP.
In addition, to ensure that the MDMS data in IT zone can be exchanged with ADMS in OT zone, Taipower uses two Data Diodes to integration of IT ESB and OT ESB for the purpose of highly cyber security. When the MDMS transfers data from IT zone to OT zone, it must pass through security protection such as content filtering to ensure the data exchange between MDMS and ADMS under the safest protection.
-
1. Introduction
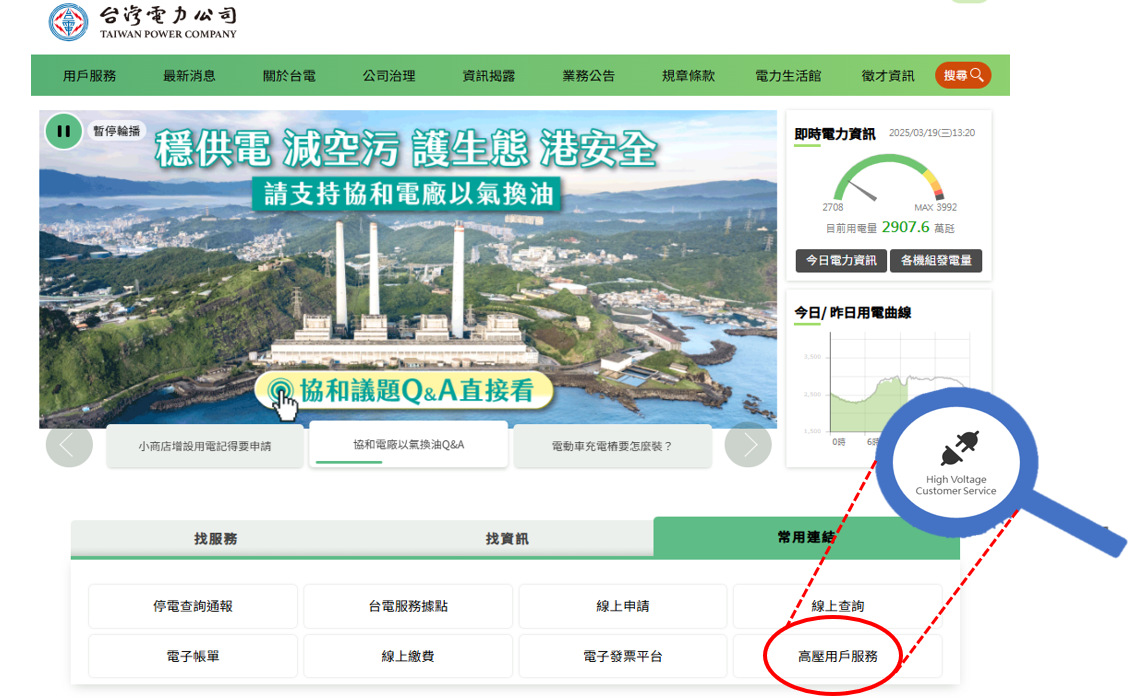
The peak load of Taiwan power system is daytime (10-18) during summer. Besides Taipower’s dispatch to remain system reliability, customers’ awareness of energy saving is also needed. In the case of high-voltage customers were fully deployed with AMI, Taipower has used communication technologies to build High-voltage Customer Service Portal (https://service.taipower.com.tw/hvcs/) to provide customers value-added services and create a win-win situation for the company and customers.
The frequency of transmission time from customers’ installed AMI to Taipower is daily. Through information and communication technology (ICT) and analysis, the data would eventually be presented by visual charts to users.
The website was officially launched in July 2016, which can help high-voltage customers manage power by themselves and help them control power consumption and electricity costs. The customer can apply for an account by MOEACA Application online or at the counter.
-
The following are website features. Detailed functions are illustrated in next section.
-
☆ Real-time electricity consumption information
Customers can fully know their power consumption through real-time and complete information offered by the website and plan to reduce electricity costs.
-
☆ Evaluation of Energy-Conservation efficiency
By using calculation function, customers can evaluate how to participate in demand response measures to reduce their electricity costs.
-
☆ Responsive Web Design
This website adopts Responsive Web Design (RWD), which can automatically adjust the screen configuration according to the mobile devices such as the mobile phones or tablets used by the customers. It helps customers use the website anytime.
-
☆ Data visualization
Customers can query the power consumption of recent periods compared to other periods by charts.
-
☆ Electricity simulation
Using historical electricity data to simulate the future power consumption will help customers understand the load of their equipment.
-
☆ Benefits of digitalization
Evaluate the benefits of customers participating in demand response management measures and help them change their power consumption or production schedules to reduce the consumption usage of peak load.
-
☆ More info:
https://service.taipower.com.tw/hvcs/html/index.html (in Mandarin)
https://service.taipower.com.tw/hvcs/Account/LogOn_ENG (in English)
-
☆ Real-time electricity consumption information
-
Function Architectures & Services Descriptions
Several website functions and services are presented as follows.
-
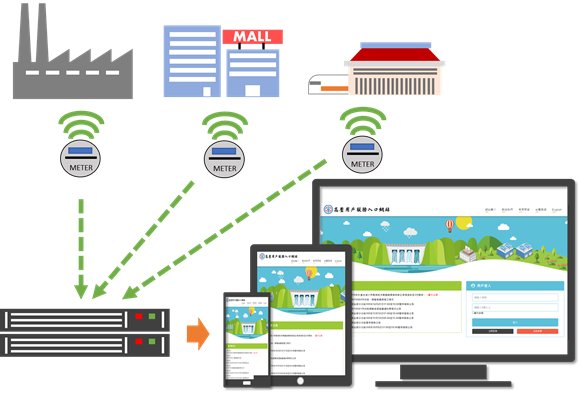
☆ Customer Information
Customers can query the highest load power consumption and electricity bill information of each period and compare the power consumption during different period.
-
☆ Power Management
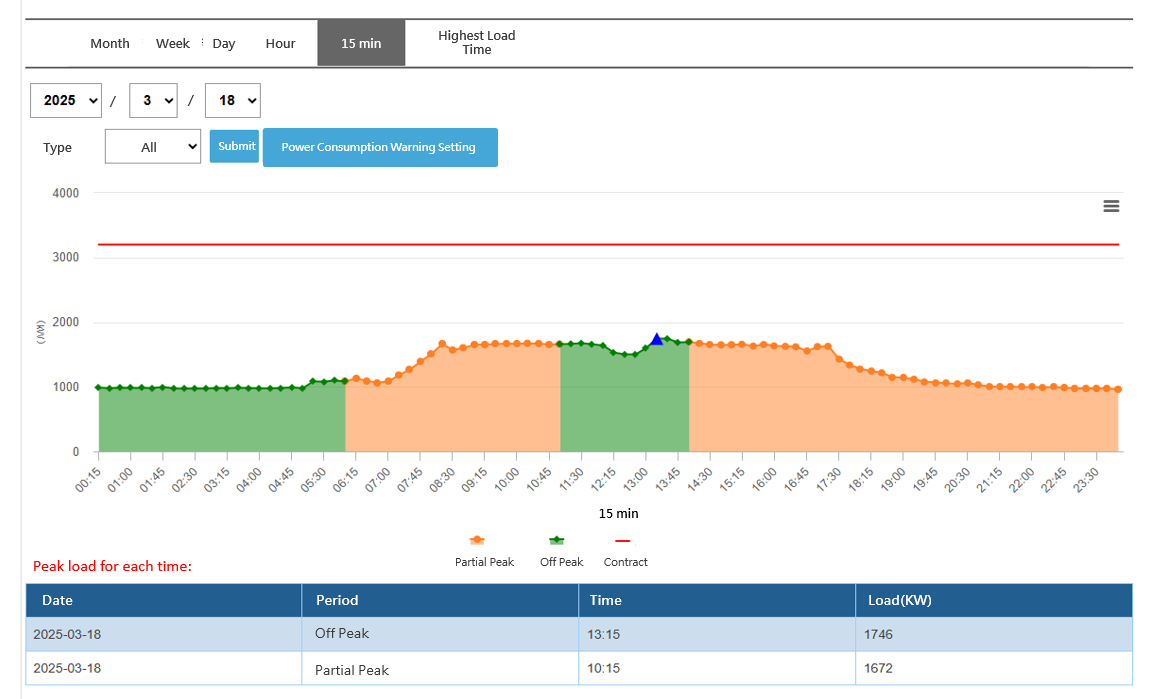
The website provides visual analysis of the power consumption information (by 15min, hour, day, week, month) which helps customers understand their own consumption and provides value-added services such as electricity analysis, trial calculation and load forecasting
-
☆ Trial calculation of Demand Response Management Measures
The website provides a variety of trial calculation services, and the results could be used as a reference for evaluating participation in every Demand Response Management program.
-
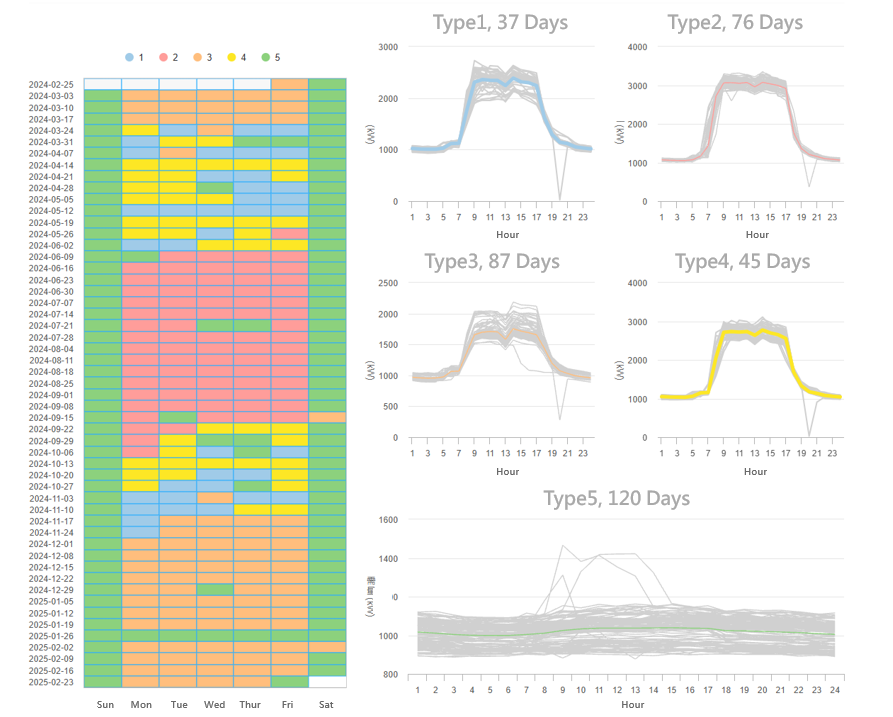
☆ Analysis of the customer daily load shape
The website provides customers to query the 24-hours daily load shape which was be analyzed by the system. It can help customers manage their power consumption autonomously
-
☆ Other value-added Services
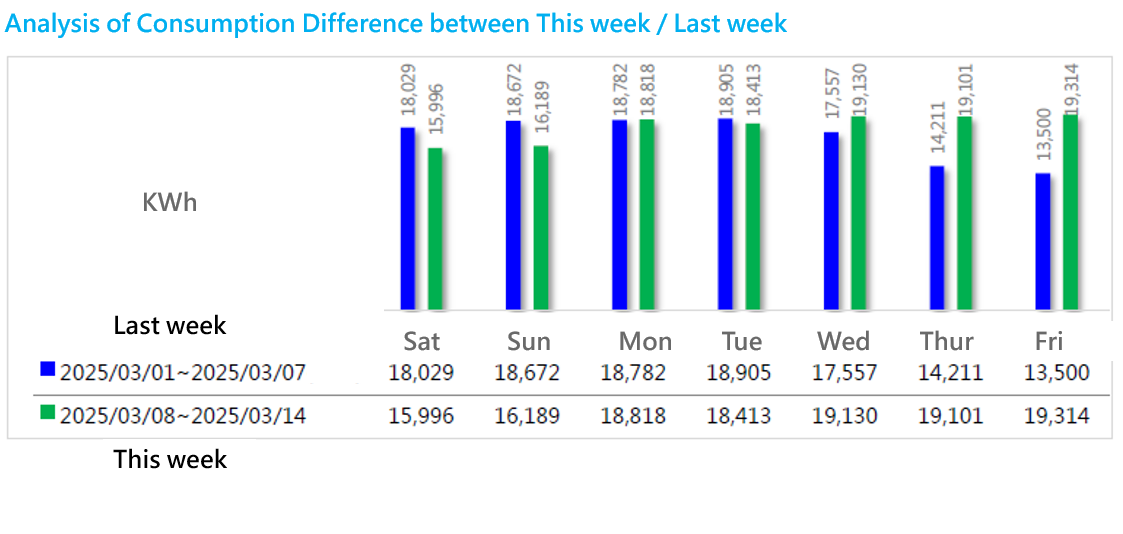
Considering a manufacturer may have multiple factories; or a service industry may have chain stores, the website provides sub-account management service, so the main manager can easily do central management.We also offer other value-added services, such as the power report. One of the charts from this report is shown in the figure below.
All services of the website are listed as below:
-
☆ Customer Information
-
■ Basic information
-
■ Comparison of electricity bills during different periods
-
-
☆ Power consumption management
-
■ Daily power dashboard
-
■ Power consumption analysis
-
■ Analysis of the customer daily load shape
-
■ Analysis of customers in same industry
-
■ Trial calculation of various electricity rate plans
-
■ Trial calculation of load
-
■ Trial calculation of contracted capacity
-
■ Trial calculation of energy charge
-
■ Analysis of equipment power consumption ratio
-
■ Load forecasting
-
■ Power consumption warning setting
-
- ☆ Trial calculation of Demand Response Programs
-
☆ Announcement and service
-
■ Announcement information
-
■ Customer Service Email
-
■ Energy saving information
-
■ Internet counter
-
-
☆ Account management
-
■ Personal account maintenance
-
■ Sub-account maintenance
-
■ Deletion of personal account
-
■ Power report subscription
-
■ Download historical power reports
-
-
☆ Customer Information
-
The following are website features. Detailed functions are illustrated in next section.
-
Future development
Since the website has been launched, Taipower keeps refining the functions and services. In the future, Taipower will continue to refine this website according to customer needs and advance in analytical technology.
-
Service Description
The TPC e-Bill service with simple registration and customer number setting has been provided to TPC users for quick inquiry of power consumption data and easy bill management. It is presented via easy-to-understand electronic interface and micro-animation such that users can have quick access to bill related information to facilitate the self-management of amount power consumption behavior and to achieve the energy saving effect.
The main visualization design of the front page is based on the illustration style with the layouts of four seasons. And there are the renewable energy subjects of wind power, solar energy, and hydraulic power generation to attract users to TPC e-Bill service in order to achieve the goal of paper reduction and environmental protection.

Figure 1 Front page main visual design (Spring)
Figure 2 Front page main visual design (Summer)
Figure 3 Front page main visual design (Fall)
Figure 4 Front page main visual design (Winter) -
Function Description
-
☆ General User
“General User” can have access to the website related information including payment status enquiry, bill pre-estimate, website tutorial, FAQ, and news.
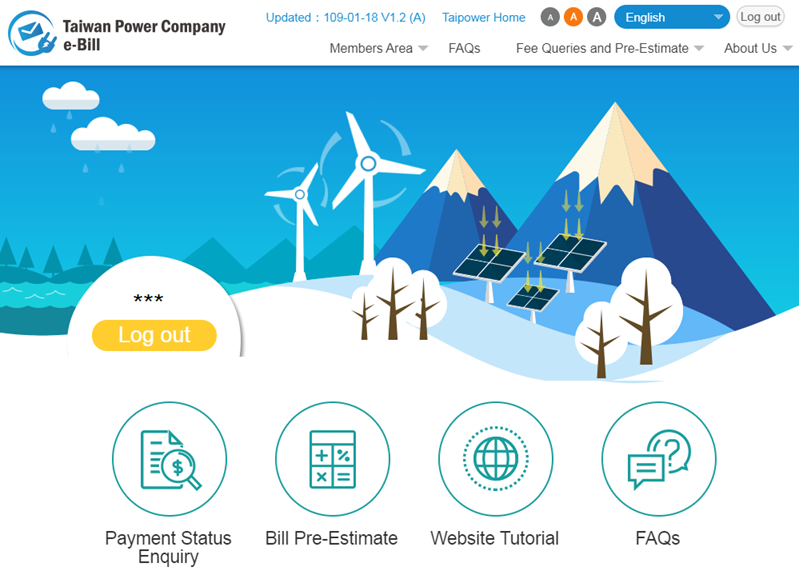
Figure 5 Front page of TPC e-Bill service -
☆ Members
Users can register to become the “Member” of TPC e-Bill service. In addition to periodic bill notification and payment certificate in the form of email, users can also have access to historical bill data.
A member could login the TPC e-Bill service to have access to the functions of basic information management, bill inquiry, and analysis of amount consumption chart. To make the operation easily, the bill information of all registered customer numbers will be listed on the login screen, and the provided functions are the latest monthly bill, total amount, payment status, the payment barcode to be downloaded (the unpaid bill can be directly downloaded), re-sending of electronic notification, and historical data.
-
☆ General User
-
AMI Real-Time Inquiry
To facilitate the real-time inquiry of amount consumption data by AMI smart meter users and thus promoting the power consumption management, the “AMI Area” icon behind the customer number of AMI could be selected to enter the AMI dashboard function, which provides various functions such as comparison of various real-time amount consumption data, self-defined upper limit of amount consumption, analysis of amount consumption statistical chart, and rate service evaluation.
Note: Users could enquire real-time amount consumption data of the previous day by noon.
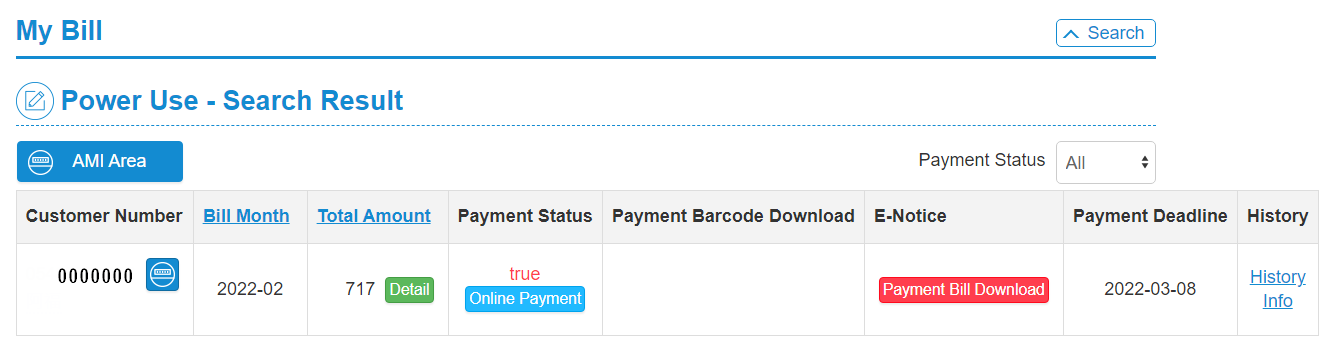
Figure 6 My Bill-
☆ The percentage comparison of total AMI amount consumption and total amount trend
The percentage comparison of total AMI amount consumption of current year and last year will be shown on the indicator dashboard. The monthly power consumption trend for the two years next to the dashboard to directly compare whether the total consumption has increased or decreased.
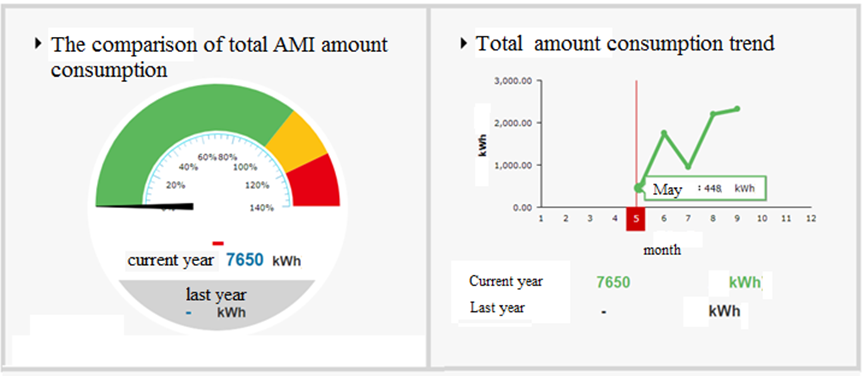
Figure 7 The percentage comparison of total AMI amount consumption and total amount trend -
☆ Comparison of average total consumption in the same area/industry
The users could check their own total consumption and the average power consumption in the same area or industry. And it would provide different contents via different scenarios to guide users to change their energy consumption behaviors.
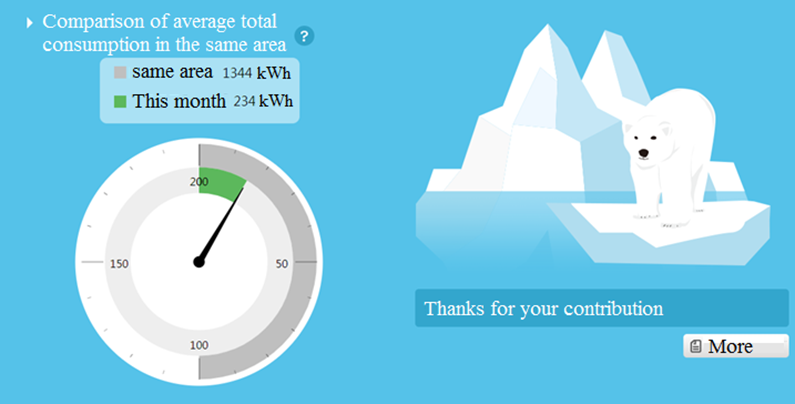
Figure 8 Comparison of average total consumption in the same area/industry -
☆ Setting Daily Power Limit
Provide users with the ability to set the upper limit of daily electricity consumption. When the electricity consumption exceeds the self-set degree, the user will be notified by email.
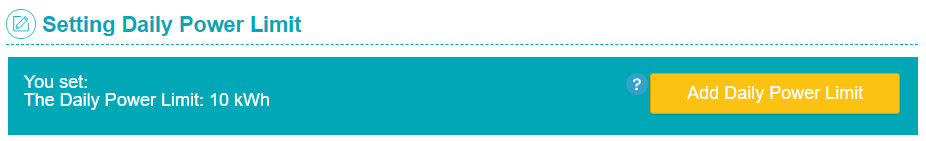
Figure 9 Self-defined amount consumption upper limit and abnormality notification -
☆ Carbon Emission
According to whether the amount consumption exceeds the " average total consumption in the same area " or " Self-defined amount consumption upper limit ", the icons of carbon emission and trees are provided to strengthen the connection between amount consumption and energy saving.
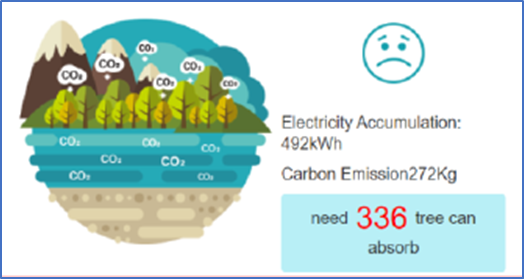
Figure 10 Carbon Emission -
☆ Monthly Consumption
The total amount consumptions of all months are presented and compared in the form of monthly pie chart, and different colors (green, yellow, red) are used to show whether or not it is increased as compared to the base month.
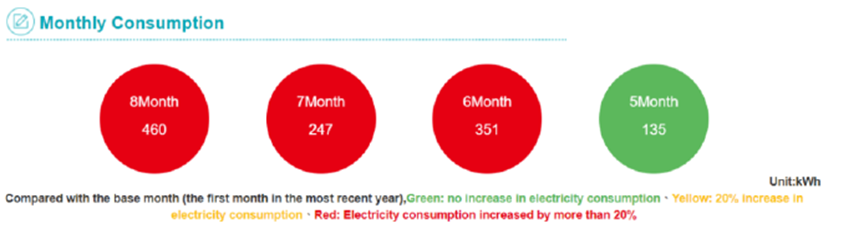
Figure 11 Monthly Consumption -
☆ AMI Statistics
The real-time and detailed AMI amount consumption charts are presented in graphics to shown the statistics based on “year”, “month, “day”, “15 minutes”, and the daily (24 hours) comparison.
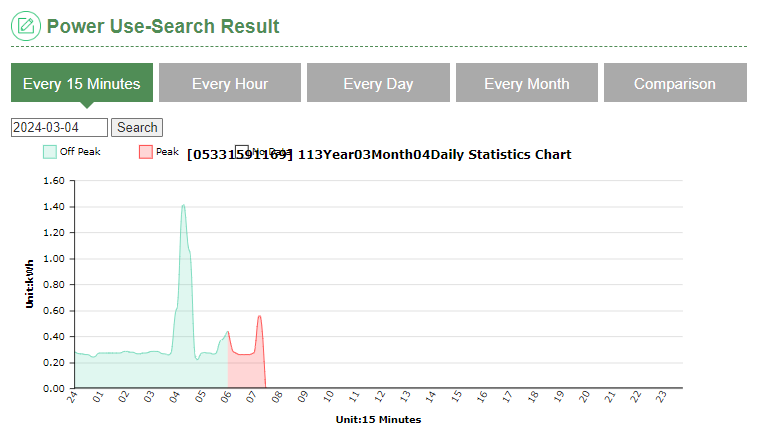
Figure 12 AMI real-time statistical chart -
☆ Rate Suggestion Pre-estimate
The trial calculation comparison amount of simple rate plan is provided according to the past AMI real-time amount consumption information of users to help users assess which rate plans are more appropriate according to their energy consumption habits.
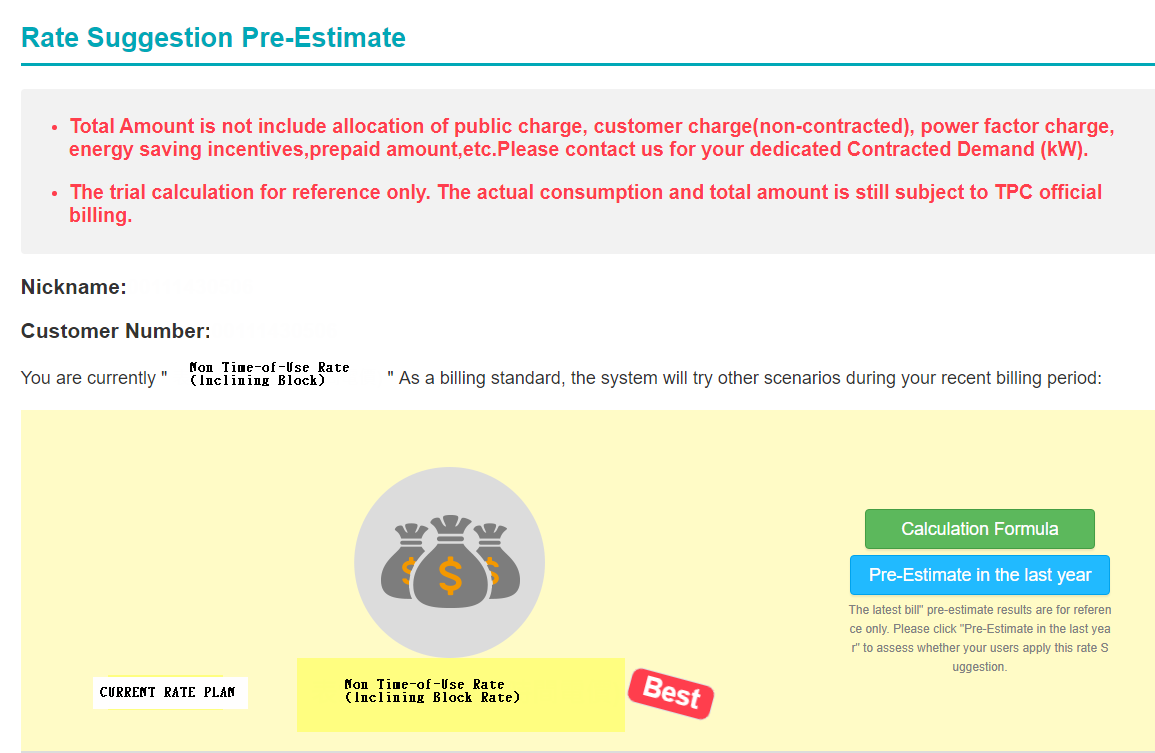
Figure 13 Rate Suggestion Pre-estimate -
☆ Unbilled Electricity Bill Amount Estimate
According to the past AMI real-time amount consumption information of users, we provide the estimate of the unbilled power consumption and the bill amount to help users control electricity usage
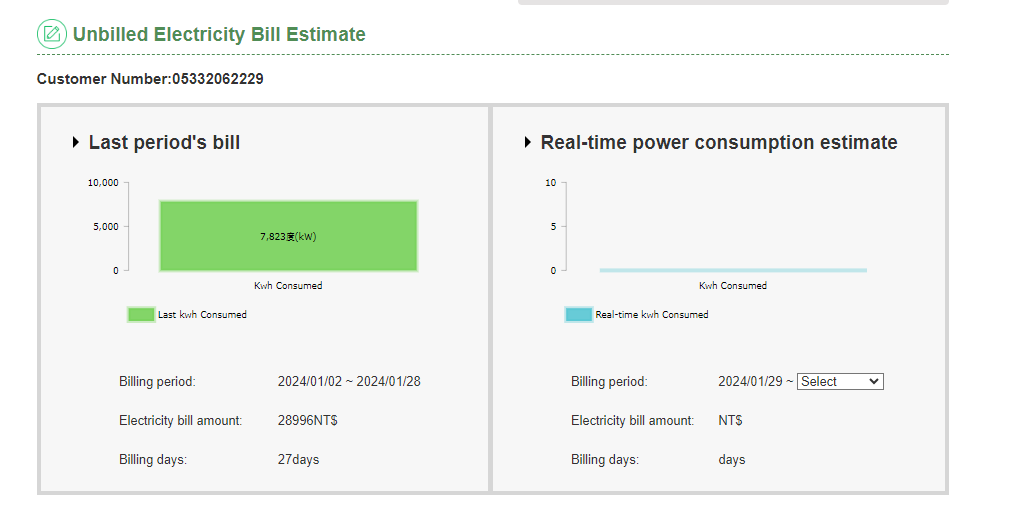
Figure 14 Unbilled Electricity Bill Estimate -
☆ Amount consumption analysis chart
Users are provided with the power consumption charts of recent 48 hours for comparative analysis with the same timeframe of last week and last month.
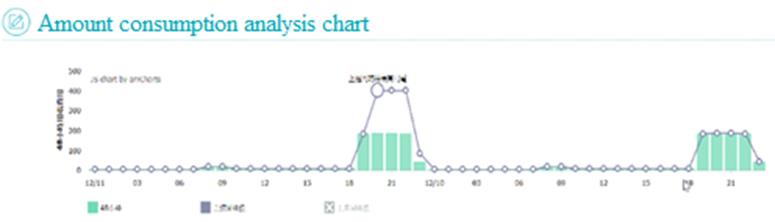
Figure 15 Amount consumption analysis chart -
☆ Maximum Demand Alert
If the Maximum Demand(kw) exceeds 95% of the Contracted Capacity(kw), the user will receive reminder email, which remind user to avoid Customer Charge(Non-Contracted) fee.
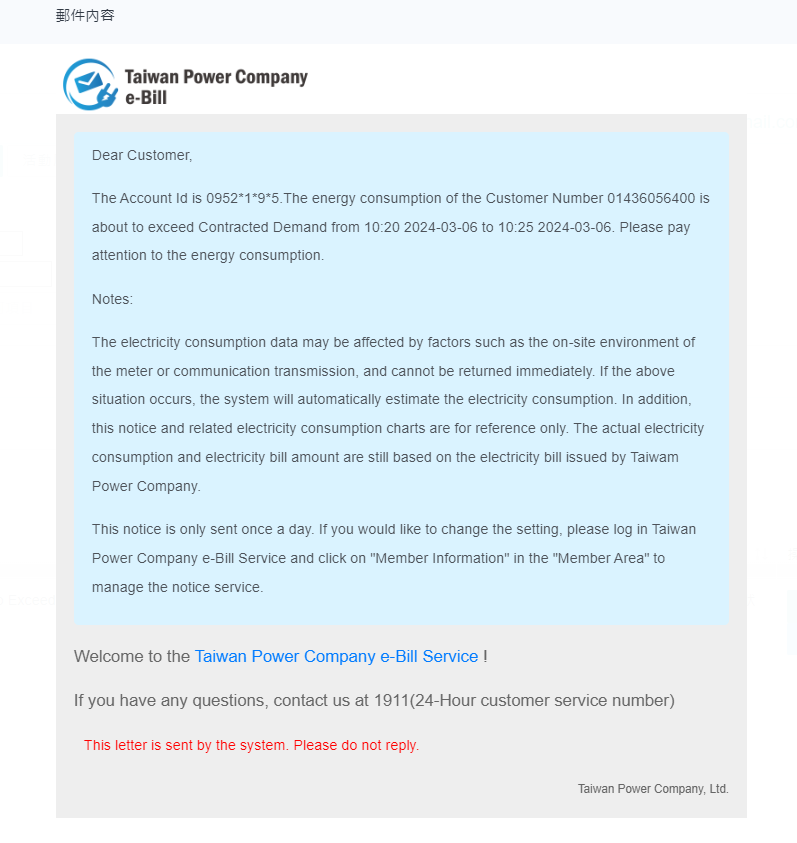
Figure 16 Contents of notification letter
-
☆ The percentage comparison of total AMI amount consumption and total amount trend
-
Future planning
-
☆ Enhancement of interactive design
We will continue enhancing the interactive service for users, and simplify operation interface and enhance the friendliness of website by user friendly and dynamic guidance approach in order to enhance users’ willingness of registration and use while achieving the energy saving efficiency of all people.
-
☆ Increase of new application functions
A new method is added to estimate the number of days of use based on the amount of electricity bill, allowing users who need to prepay electricity bills to estimate the number of days that the prepaid amount can be used, and then determine the prepayment amount according to needs.
-
☆ Continue to integrate member accounts with Taiwan Power APP
Allow users to use services on various platforms of TPC through a single set of account passwords.
-
☆ Enhancement of interactive design
-
Taipower APP
In response to digital transformation and the development of virtual channels, a mobile application (App) was launched at the end of 2016. By leveraging mobile devices, the App introduces innovative and diverse products and services to enhance customer experience and satisfaction. It provides five main functions: electricity usage management, electricity service applications, message notifications, billing services, and service location inquiries.
In 2020, the App was officially renamed “TaiPower” and underwent a major redesign at the end of 2021 to optimize the user interface and experience. Additionally, new features are continuously added each year, such as AMI service applications, power failure report by map and address, Residential Electricity Analysis, and AMI outage notifications. The App integrates various products and services, aiming to diversify payment services, enhance electricity usage transparency, enable two-way safety notifications, unify energy services, and foster customer engagement through social interaction. These five mobile development strategies comprehensively enhance user experience, aligning with the company’s vision of customer-oriented and smart mobile services.
-
1. Taipower APP function
Electricity overview, case, members only, more and shortcut botton .
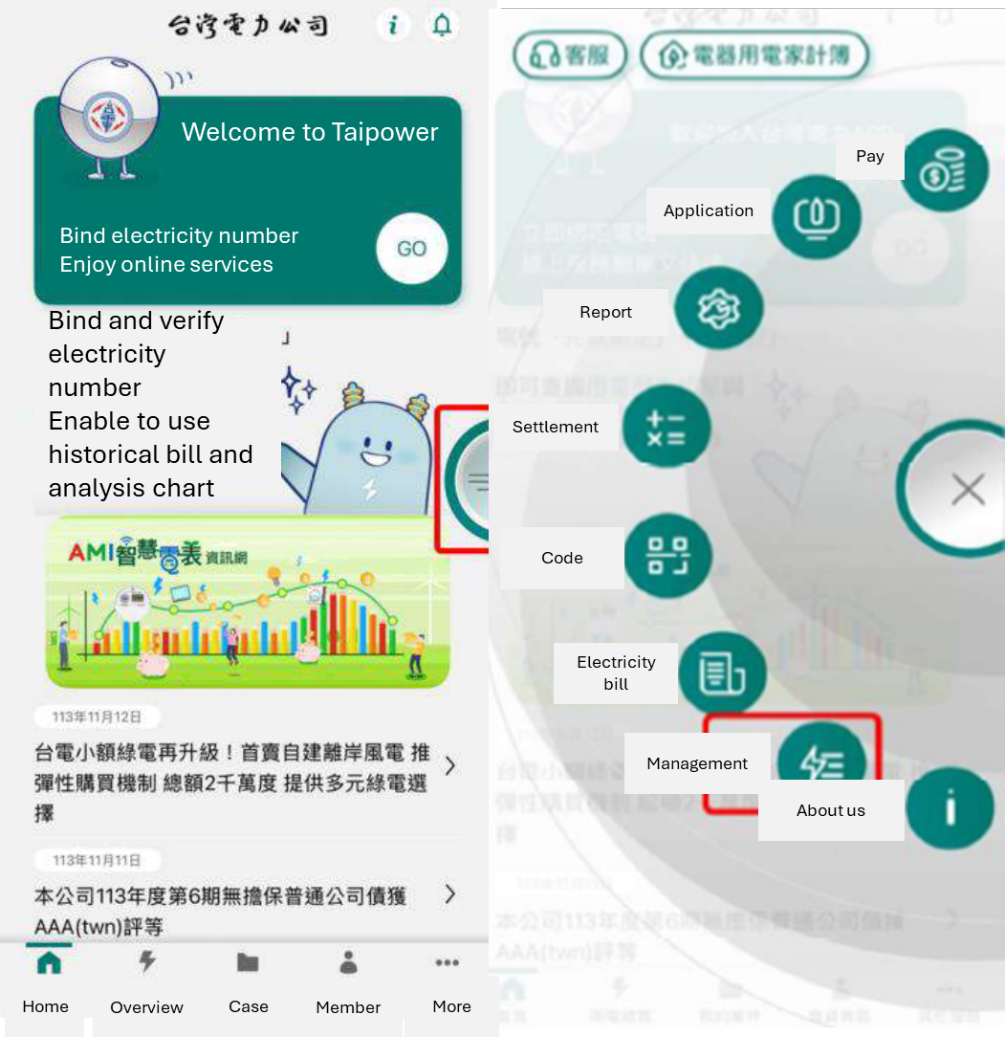
-
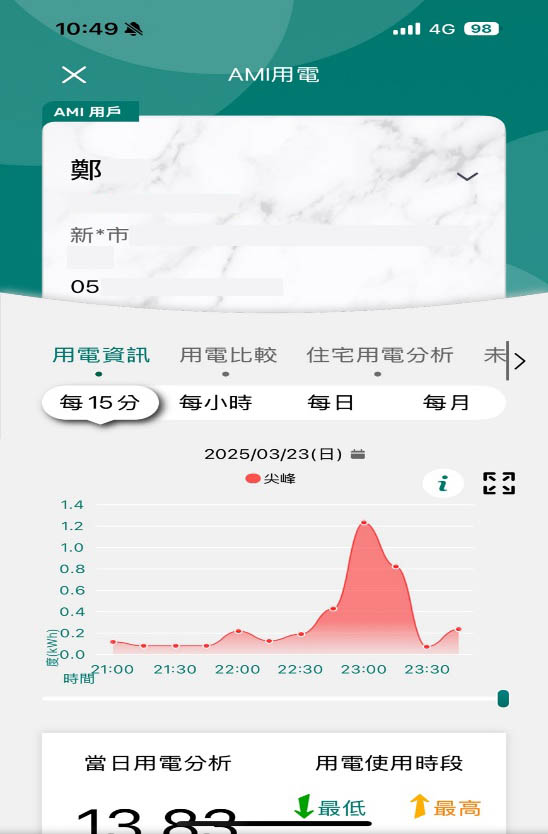
2. Electricity overview
Not only provide the latest electricity bill, but also provide historical bills and analysis chart. If user’s meter is AMI and AMI’s transmission is stable, can using AMI service application features, such as electricity comparison, analysis, price and so on.
-
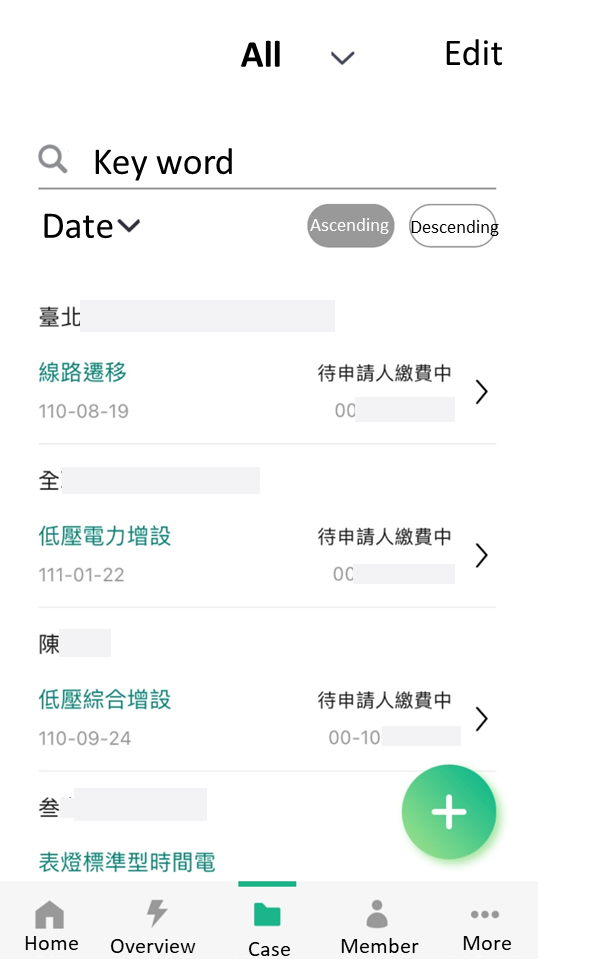
3. Case
Provide add, delete and arrangement.
-
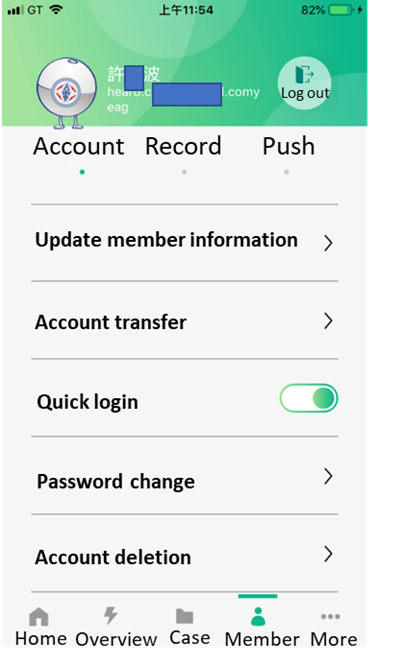
4. Member only
Account setting, payment record and push setting.
-
5. More
News, customer service hotline, inquiry of service center, website link.
-
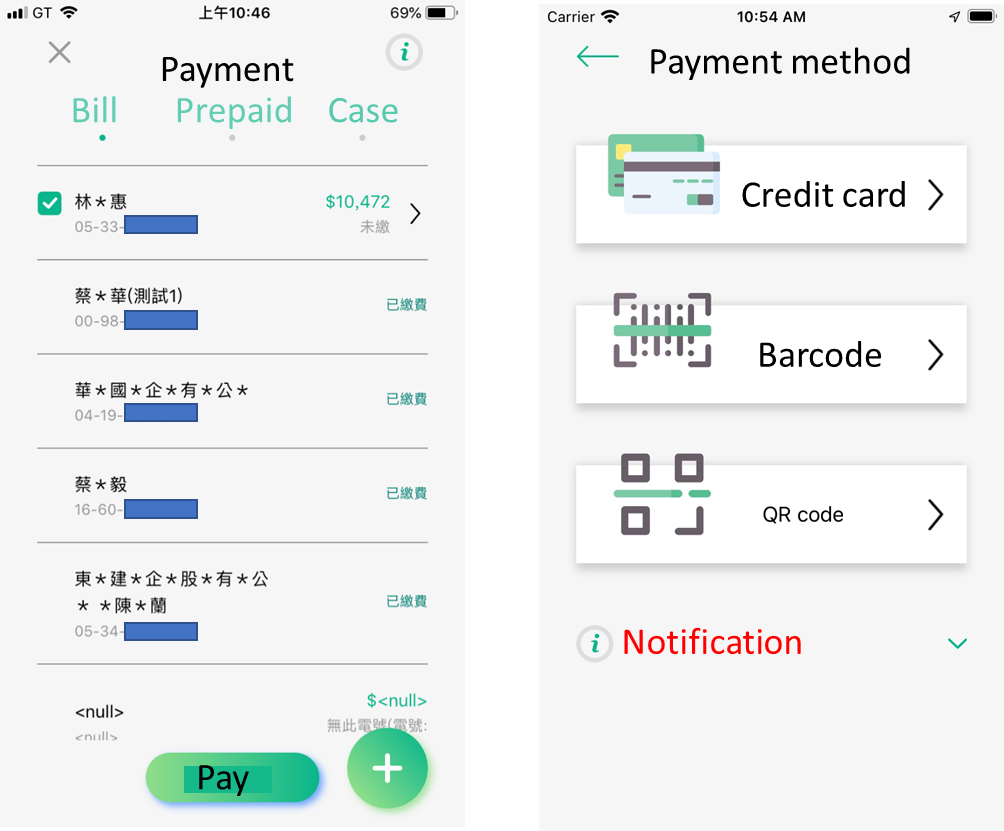
6. Pay
Not only provide electricity bill payment, prepaid, but also provide case payment. And the payment can be made by either credit card, bar code or QR code.
-
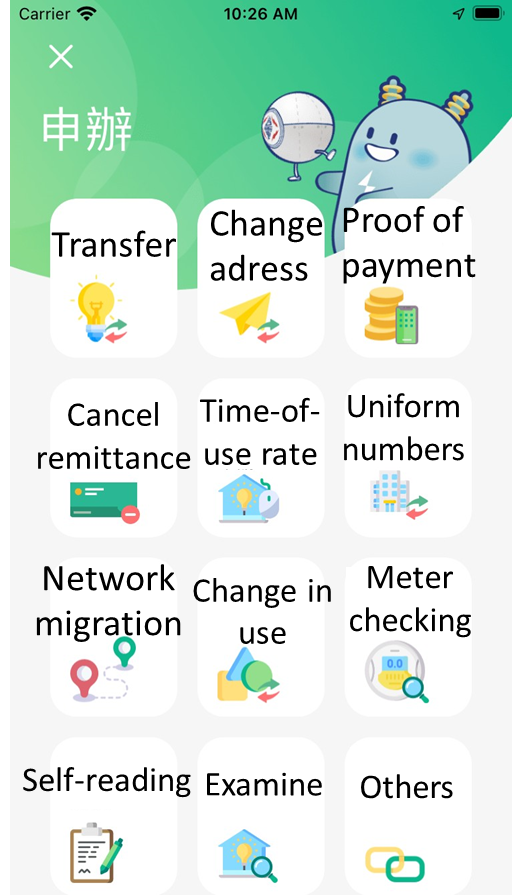
7. Application
Change of power use data and application for onsite inspection, power supply circuit failure report and so on,
-
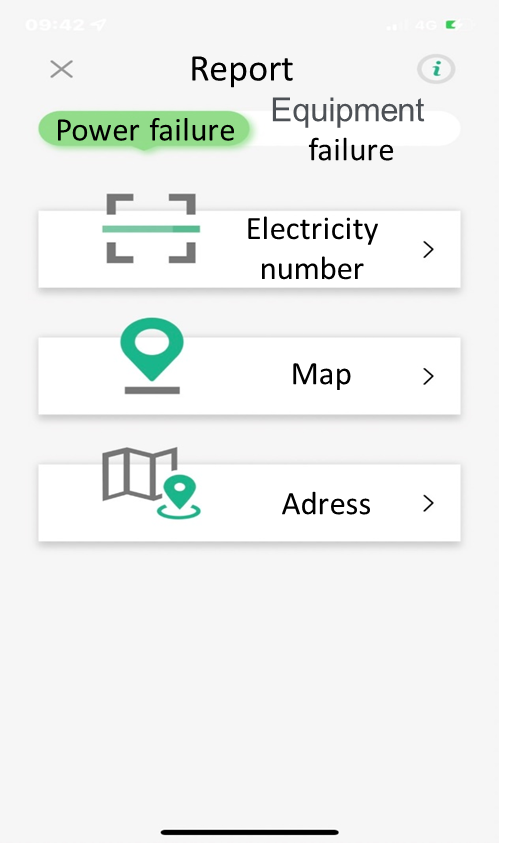
8. Report
Power failure report.
-
1. Taipower APP function
-
Electricity rate plan
TPC has been promoting load management for over 40 years, and it continues to take on the responsibility of stable power supply for the entire Taiwan. From the demand management perspective, it has used the price incentive to guide customers to change power consumption behaviors in order to reduce peak power consumption and to achieve power supply stability. The price-type demand response measures currently being promoted by TPC include: Inclining Block Rate (IBR), Seasonal Rate, Time-Of-Use (TOU) Rate, and Critical Peak Pricing (CPP).
Inclining Block Rate (IBR) refers to the pricing according to different blocks of power consumption block. Currently the pricing is determined via 6 blocks, and the price per kWh is ranging from NTD 1.78 to NTD 8.86. Under such rate structure, the electricity bill will be increased along with the increase of power consumption. IBR can prompt users (especially those who consume a lot of electricity) to reduce unnecessary power consumption, thus enhancing the energy use efficiency and helping TPC to achieve the obligation of energy saving and carbon emission reduction. Most residential houses and small commercial users are using IBR plan.
The Seasonal Rate is for reflecting the higher power supply cost in summer. TPC’s Seasonal Rate is determined by two seasons (Summer and Non-summer), and it is implemented in all rate plans (except for the package rate). Seasonal Rate will force some users (such as large factories or enterprises) to shift a part of power demand to non-summer months. Even if the shift is impossible, Seasonable Rate can also contribute to the reduction of power demand during peak hours in summer while encouraging the enhancement of energy efficiencies of power consuming appliances. In addition to the package rate users such as streetlights, currently Seasonable Rate is applied to all users.
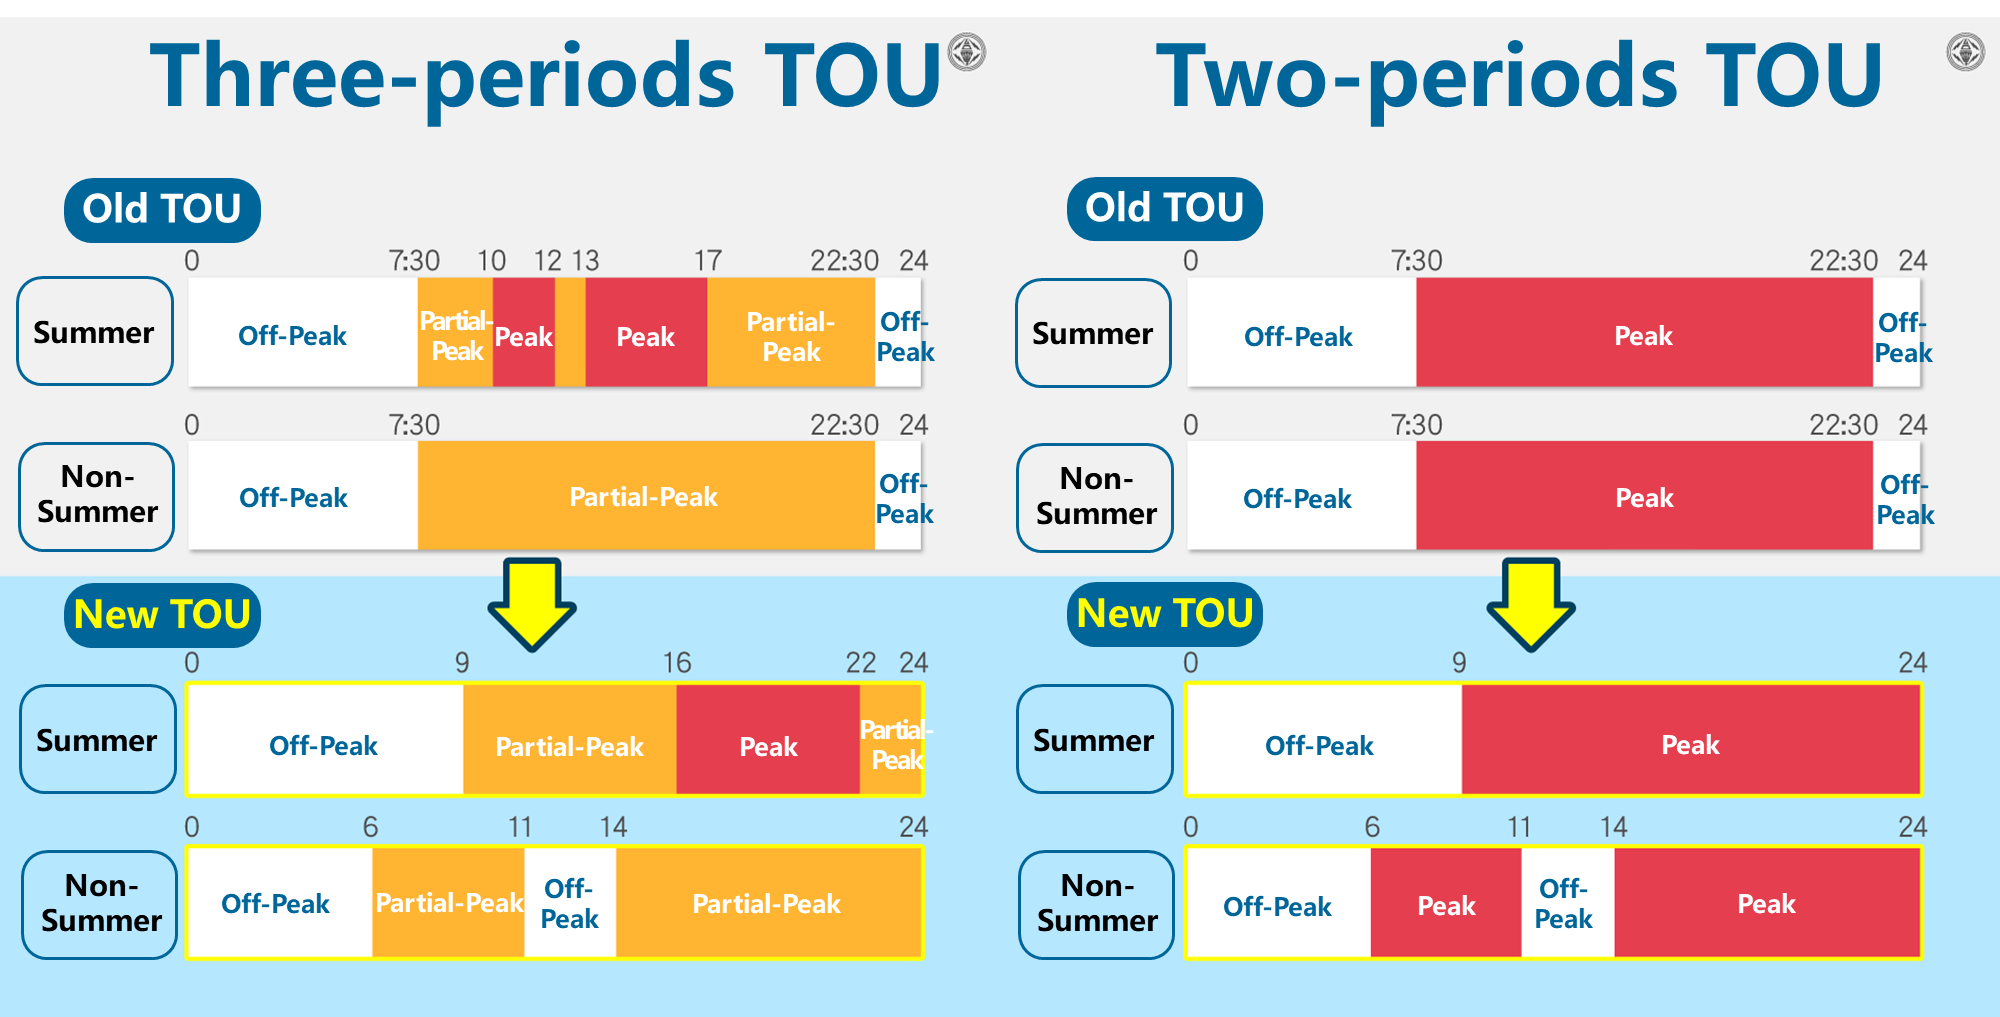
Time-Of-Use Rate refers to different electricity rates for different times of use. Currently TPC has introduced a total of 16 Time-Of-Use Rates for various users, which can be divided into two major categories: one is the rate including peak periods and off-peak periods (three-periods TOU), and the other is the rate including the partial -peak periods (two-periods TOU). TOU Rate can make most users shift power consumption during peak hours. Even if users cannot shift the power consumption load, TOU Rate can still encourage users to reduce the energy consumption during peak periods and to enhance the energy use efficiency. For example, users will try to raise the set temperature of air conditioner during peak hours in summer to conserve energy. So far, TOU Rate is enforced on users of high voltage and above, while it is optional for low voltage users. Users of TOU Rate account for 70% of all users.
In recent years, renewable energy (especially Photovoltaic solar energy) has increased significantly, and electricity demand peak has shifted from daytime to evening. Therefore, TPC has adjusted TOU period in 2022 on a pilot and formally implemented in 2023. Take three-periods TOU for example (divided into peak, partial -peak, and off-peak periods), the new TOU shifts the peak period from 10 a.m.-12 p.m. and 1-5 p.m. to 4-10 p.m. to provide accurate price information and guide users shift the power consumption load from evening to daytime, make full use of carbon-free energy, and implement energy conservation and carbon reduction.
The deployment of AMI allows TPC to adopt more delicate and diversified design of electricity rate plan, thereby launching diversified TOU rates, including: “Simple TOU Rate” introduced in 2016 for residential and small business which has a total of 163,358 users selected it in 2025; “Three-periods TOU for low tension service” introduced on May 1, 2021 to provide more diversified electricity rate options for low tension users which has a total of 20,223 users selected it in 2025; ”Electric vehicle charging infrastructure rate” with the development of electric vehicles introduced on May 30, 2022 to guide car owners in charging management which has a total of 996 users selected it in 2025, and introduced “Time-of Use Rate (C)”for High Voltage & Extra High Voltage Service on November 1 2023 to fulfill the Industrial users and power system which has a total of 676 users selected it in 2025
Looking to the future with the Big Data and real-time bilateral communication function provided by AMI, TPC will persist in developing more diversified and dynamic electricity rates as well as various energy saving measures. TPC hopes to make users adjust their power consumption behaviors in coordination with cost variation and system situation. If so, it could reduce the costly power generator scheduling and thus reducing TPC’s demand for peak capacity and overall power system cost.
-
Demand Response
Due to the ever raising living standard, the demand for electricity in Taiwan has been stringent. Paris Agreement sets out a global action plan to put the world on track to avoid dangerous climate change by limiting global warming. Additionally, Taipower’s projects for power development have been hampered by difficulties in land acquisition and by opposition from various environmental protection movements. Consequently, engaging customers in demand-side management can always help solve a part of power supply problems. And for the reason, Load Management is adopted universally in order to increase the reliability of power supply and the efficiency of power utilization and to reduce the cost of power supply.
In order to increase the reliability of power supply and efficiency of power utilization, Taipower has accommodated customers with load management by adopting Demand Response Programs since 1979, with the first program of TOU Rate. The following programs have been implemented at present:
-
☆ A. Time of Use Rate
-
☆ B. Seasonal Rate
-
☆ C. Preferential rate for Ice Storage Central Air-Conditioning System
-
☆ D. Demand Response & Load Management Program
-
■ a. Scheduled Load Reduction Program
-
■ b. Emergency Load Reduction Program
-
■ c. Demand Bidding Program
-
■ d. Intelligent Load Reduction Program(In 2026, a new Residential and Commercial Automated DR Program was introduced. The program integrates demand response aggregators and smart appliance providers to remotely and automatically control participating users’ appliances for load reduction when required by the power system, providing a new energy-saving approach for residential and commercial users.)
-
■ e. Energy Storage Load Reduction Program ( only for compulsory users of renewable energy)
-
-
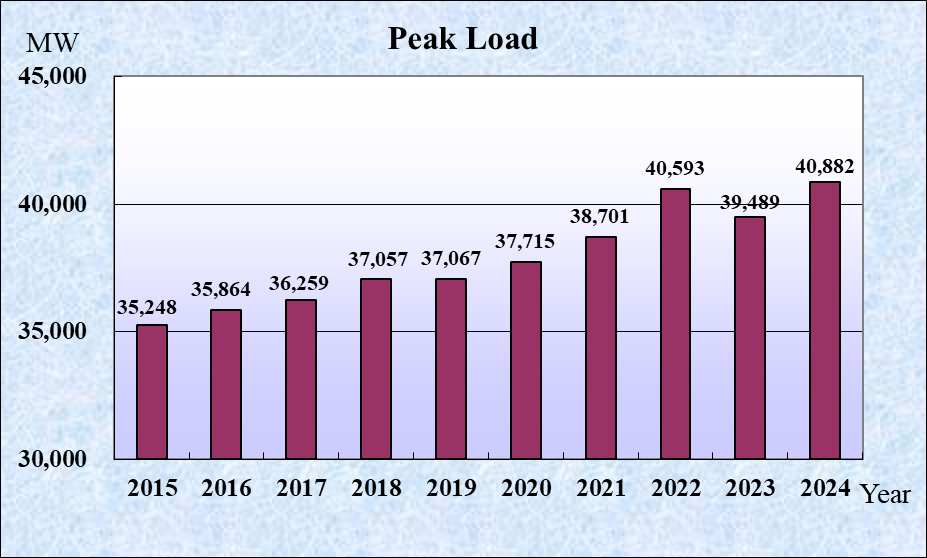
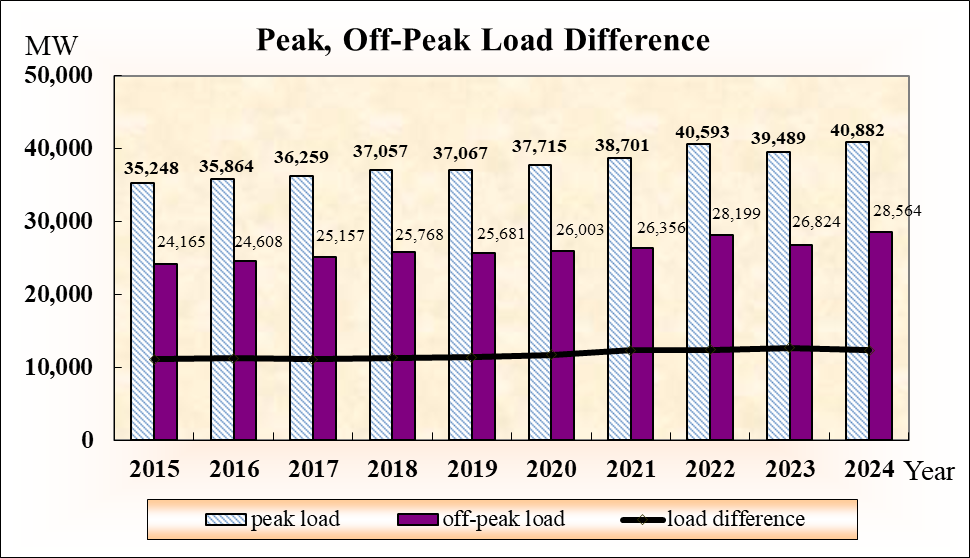
The load profile in recent years in Taiwan are illustrated as follows:
Owing to the continuing growth of domestic economy and the promotion of the living standard, the demand for electricity has become much more stringent than before. It had boomed system peak load from 35,864 MW in 2016 to 40,752 MW in 2025. In year 2023, however, the system peak load declined over the previous year due to several short-term circumstances, including lower average annual temperature and slow recovery of post-pandemic global economy.
In 2025, the peak and off-peak load were respectively 40,752 MW and 27,888 MW. The proportion between peak and off-peak load was 1:0.6842.
In order to reduce the demand for power and the growth of peak load, Taipower has implemented demand response program to encourage customers to transfer the period of production process from peak load to off-peak load. In October, The month of the most capacity that the customers applied (Including DR resource for Ancillary Servic)for in 2025, 4,335 customers chose to participate in this program and applied for 3,663MW contracted reduction load. During the night peak day (July 3, 2025), the peak of net load was clipped by 1,167 MW.
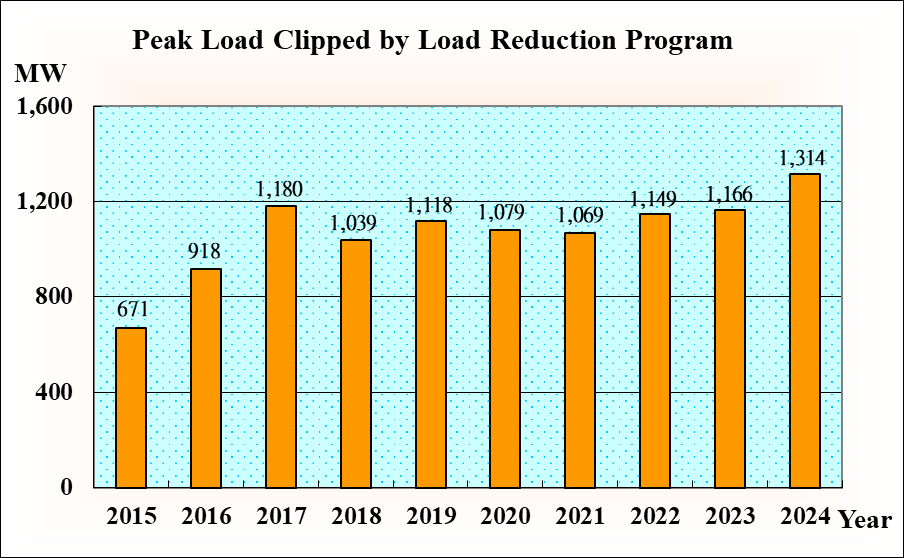
Note: Taipower has implemented a new time-of-use rate system starting from 2023. The system involves a reconfiguration of peak and off-peak hours. Since then, Taipower's demand response system has shifted the execution time respectively to clip net load.
In the future, Demand Response will be promoted continually through combining pricing strategy with hardware improvement. Furthermore, to enlarge the participation rate of the customers, Demand Response will be enhanced through R&D, absorbing the experience from other power companies, and taking the customers’ opinions into consideration. Moreover, with the advent of advanced meter infrastructure (AMI), Taipower will diversify its Demand Response Programs to encourage voluntary load reduction according to price signals.
-
1. Foreword
-
☆ Actual demand
The trend of climate change has become more and more significant in recent years. The rising average temperature in summer has led to record breaking power peak load. From the peak load of 35,860MW in 2016 to 40,750MW in 2025, it has increased year by year. Among them, the peak load in 2023 decreased by about 330 MW compared with the same period in 2022. The decrease in electricity consumption was mainly due to the global economy being affected by inflation and high interest rates in 2023, and the end market demand was weak. The industrial chain continues to destock, suppressing manufacturing production performance. In addition, Taiwan's economic policy signals throughout the year are almost sluggish blue lights, so electricity consumption decreases. However, the above phenomena are mostly short-term temporary factors, and the power load will continue to grow in the long term.

-
☆ The impact of economic development on the environment
Electric power is essential in modern society. Most production activities are driven by electric power, and the consumer activities also rely on electric power. However, the production and consumption of electricity will also bring environmental pollution and the increase of social external cost. Countries all over the world have put great emphasis on the problem of energy use based on the consideration of economic growth and people’s living environment.
-
☆ Actual demand
-
2. Power saving service team formed by TPC
-
☆ Basis
TPC has implemented the energy saving carbon reduction policies according to laws and regulations, in which it is stipulated that electricity enterprises should formulate annual plans for encouraging and assisting users to carry out power saving. Meanwhile, TPC has set up “Power saving service team” in each branch office since December 2018 for the purpose of strengthening of power sales business and expansion of customer service strategy. And the power saving potentials of users of high voltage and above have been investigated by using smart meter data analysis and simple diagnosis questionnaire.
-
☆ Targets of interview and setting of power saving KPI
Because the standards of users’ energy auditing, which is using over 800kW per month, has been made by the Bureau of Energy, so users between 300kW-800kW are the prioritized targets of interview by us, and the key performance indicator (KPI) has been set. The target of 2025-year electricity saving potential is 98.5 million kilowatt-hours (the actual result is 116.5 million kilowatt-hours); the number of households visited is 4,000 (the actual result is 4,165).
-
☆ Interview measure
The interview includes the provision of power consumption analysis, power consumption statistics, and optimization of power factor in order to understand user situation (such as user manufacturing process, and the operation situations of air conditioning and lighting equipment in the factory), provide suggested measures, and establish trust relationship with users to serve as the basis for subsequent development of energy saving diagnosis technology service.

Up to 2024, the power saving service team has completed the interviews of a total of 12,882 customers with total power saving potential of 33,150 (Unit: 10,000 kW⋅h) as shown in the table below.
Table 1. Data status of visited users and power saving potential in the past three years
Date Number of interviewed Power saving potentials (10,000 kWh) 2023 4,527 10,623 2024 4,190 10,877 2025 4,165 11,650 Total 12,882 33,150 -
☆ Organizational adjustment
In order to execute the plans and diagnosis of energy conservation, our organization has been readjusted of which Energy Conservation Section is from Chief of Maintenance to Chief of Sales for the Class-A branch (9 branches), and also renamed as Energy Conservation And Service Section on January 11, 2019. In addition, we also re-originized the structure of the Class-B branch (8 branches) as Class-A branches on August 23, 2022.
-
☆ Basis
-
3. Development of TPC’s energy saving diagnosis technical service capability
-
☆ Cultivation of energy saving diagnosis technical service personnel
To facilitate the participation by power saving service teams of all branch offices in the energy saving diagnosis technical services, we have already completed 5 training courses as of December, 2026, and we’re going to hold 5 training courses this year. In the future, we will continuously promote the official license of Energy Service Company business to establish the traing system.
-
☆ Provide the service of energy diagnosis of each branches
The Taiwan Power Energy Diagnostic Centers has been to be established in July last year in Taipei West Branch, Taichung Branch, and Kaohsiung Branch. Users with contract capacity of 500kW-800kW in the representative industries (such as manufacturing industry, department store industry, and hotel service industry) will be selected for energy saving diagnosis conducted by professional teams. The energy consumption tests will be completed with respect to energy consumption equipment in the factory by using test tools and survey form in order to provide improvement suggestions and conduct effectiveness assessment. At least 251 cases of diagnosis service reports has been to completed by the end of 2023 and 303 cases of diagnosis service reports has been to completed by the end of 2024 and 307 cases of diagnosis service reports has been to completed by the end of 2025.
-
☆ Cultivation of energy saving diagnosis technical service personnel
-
4. Future plan
To encourage various sectors to collaborate with Taiwan Power Company to promote user-side energy management services. By using user-side communication modules (Route B) to obtain real-time electricity usage data from low-voltage smart meters (AMI), energy management services can be provided to users. In addition, high-voltage users are mainly in the manufacturing industry. We assist high-voltage users in taking stock of the energy-saving potential of energy-consuming equipment to achieve the goal of maximizing energy efficiency. In line with the government's Energy Efficiency policy to help users save energy, the company will continue to expand the inventory of energy-consuming equipment in the manufacturing industry. In addition to the existing air conditioning and lighting equipment, the motor section will include inspections of water pumps/exhaust fans, user transformers, and improve energy-saving coaching to implement electricity savings.
-
◆ Customer Satisfaction
-
■ customer satisfaction survey
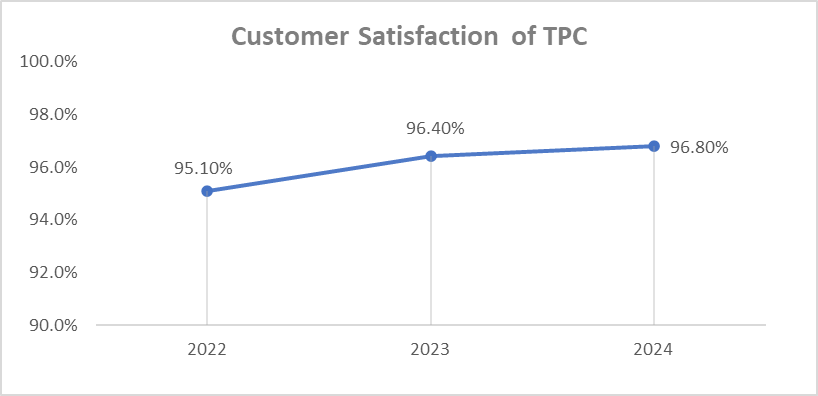
Each year, MOEA commissions a professional research company to do our company’s customer satisfaction survey. In 2025, our customer satisfaction reaches 96.4%.
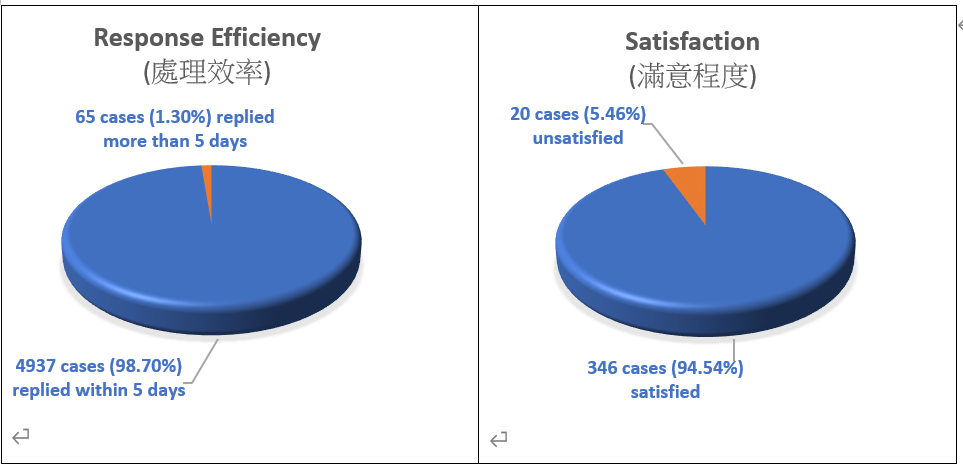
In the Customer Opinion Mailbox, we received 4,842 pieces of feedback from any customers in 2025. 4,744 cases (97.98%) were replied within 5 working days. Also, there were 293 pieces of satisfaction survey questionnaires , and 268 of them were satisfied(91.47%).
-
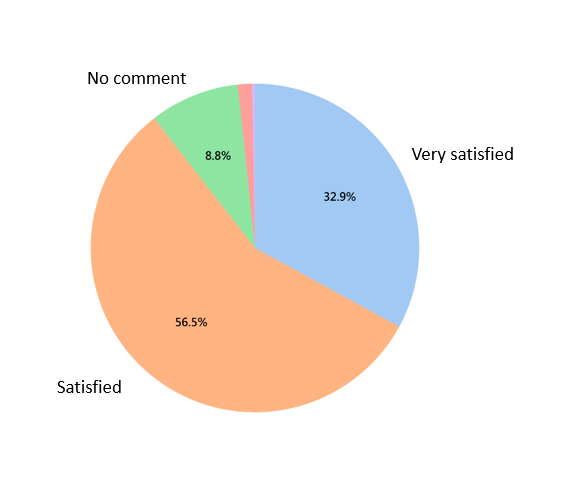
■ Website usage satisfaction
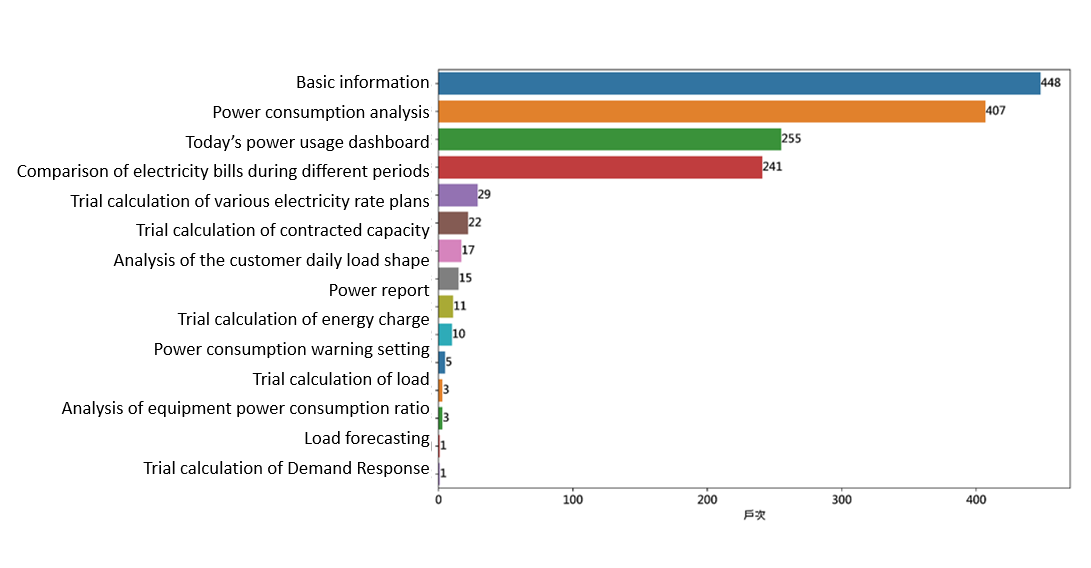
The High Voltage Customer Service Portal registration rate in 2025 was as high as 90.8%, and the contracted capacity of registered users accounted for 97.2% of the total. The analysis of the annual website usage satisfaction showed that 1,180 users completed the questionnaire and satisfied users accounted for 90.6%. In terms of function usage, users with the three functions of "basic data", " Today’s power usage dashboard", and "Power consumption analysis" thought that the most helpful and satisfied.
In the future, this website will still focus on user experience & satisfaction and continue to optimize visual charts to bring users specific energy management benefits and innovative service experiences.
-
■ customer satisfaction survey
-
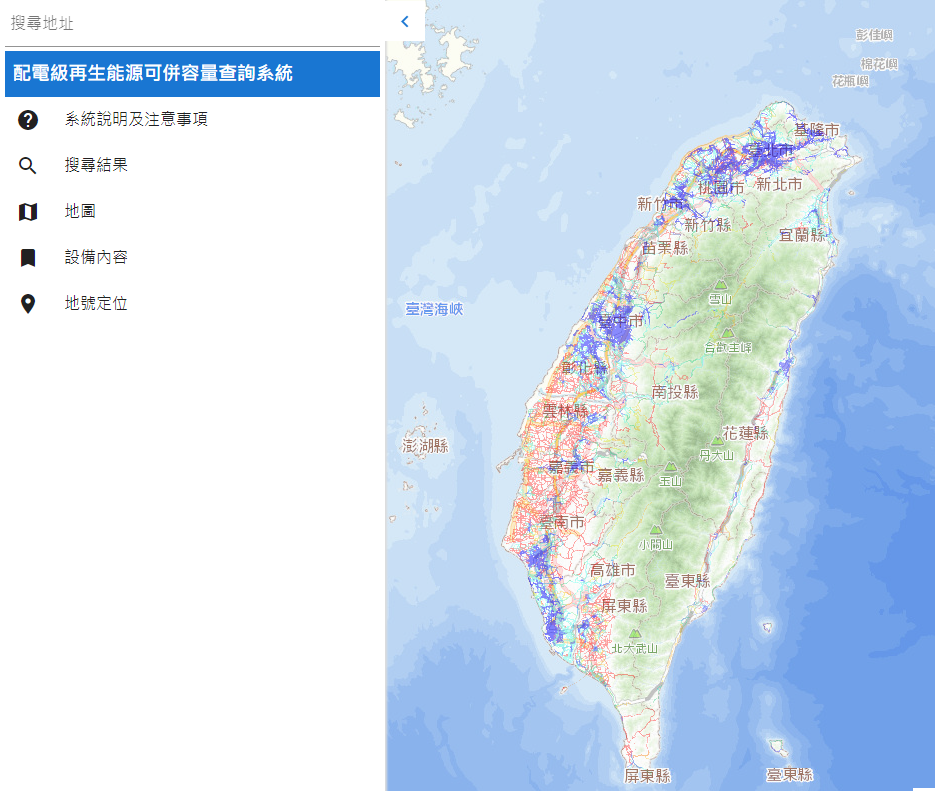
◆ Open Information Online Hosting Capacity Map
At present, the renewable energy only parallels some feeders, resulting in insufficient grid connection capacity of feeders. In order to solve this kind of problem, Taiwan Power Company has built "Open Information Online Hosting Capacity Map "(shown in Figure) through which the external users can query the grid connection capacity, feeder distance and evaluate the investment benefit. In addition, in order to help the renewable energy industry understand the progress of the application cases, Taiwan Power Company also build a website for renewable energy industry to accelerated renewable energy growth.